A map is the main container of the different layers that can be enabled on TS.
All the information provided by the layers is shown on the map.
![]()
If you click on a shoulder component (for example, LAYERS LIBRARY), the component opens, rotating by 90 degrees.
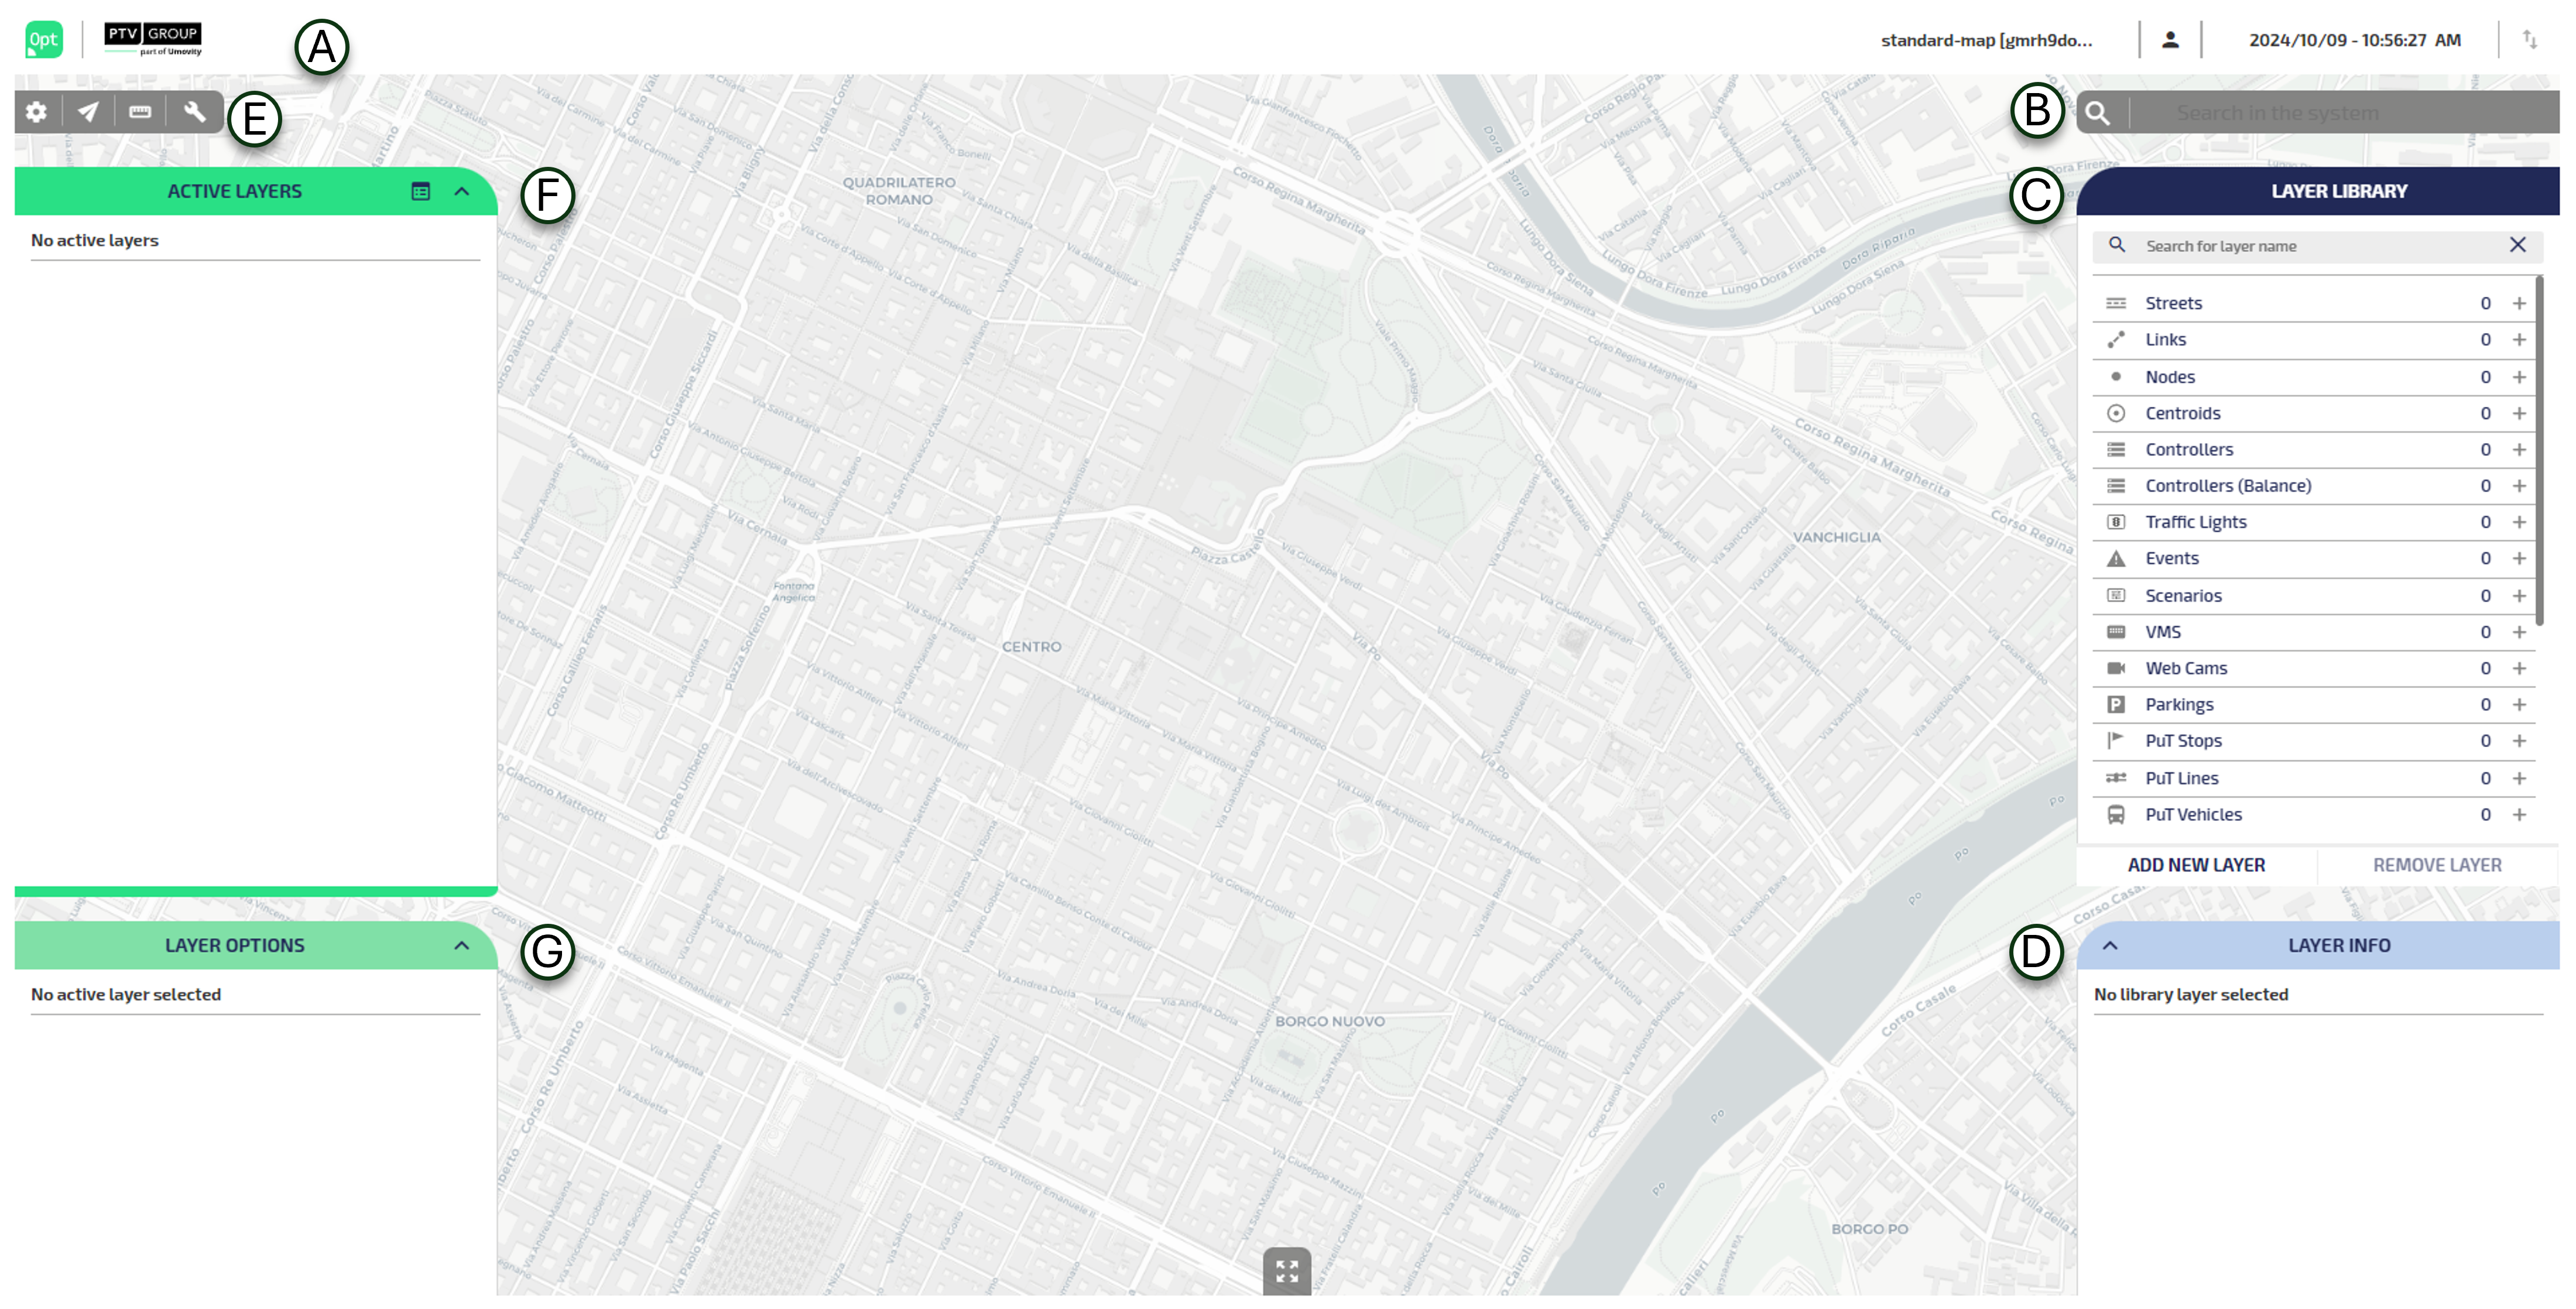
You can click on the header of an open shoulder component to close it.
The main seven areas are associated to the indicators A, B, C, D, E, F and G.
| Indicators | GUI Area |
|---|---|
| A | Upper Bar |
| B | Search Bar |
| C | LAYERS LIBRARY |
| D | LAYER INFO |
| E | Toolbar |
| F | ACTIVE LAYERS |
| G | LAYER OPTIONS |
| Items | Description |
|---|---|

|
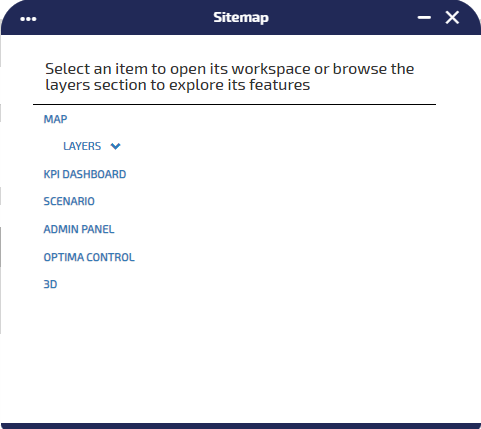
Click the PTV Optima logo to access three shortcuts:
|
|
|
Click the OptimaCompanion icon to access the chatbox. Companion is the intelligent assistant based on a Generative Artificial Intelligence engine, fed with Optima documentation material. Tip: This icon is only visible if the tag <hasChatbot>= true. See → Global configurations for more details.
|

|
Placeholder for customer logo. |

|
Detection and Control KPI list. The red bubble shows the number of active alerts associated through the Optima Detection and Control module (→ Optima Detection and Control (ODC)). Click the bell icon to access the list of alerts (→ KPI alerts). |
|
Administration area |
Click
|
|
Calendar area |
It displays the date in local format. If you click on a date, you can associate a day type to a specific set of dates (or to a single date). See → Associate a day type to a date (to a set of dates). |
|
Connection area |
Click
|
Through the Search Bar, you can search for traffic model elements stored in the system.
You can also use specific commands for a detailed search or to perform operations - as long as you apply an appropriate command line syntax.
The main syntax expressions are as follows:
- item
- command item [{idno|Id} = value]
- Layer : item
| Command items | Description |
|---|---|
|
command |
The values for this parameter are: add, show, open, etc. |
|
item |
The values for this parameter, which is related to the Traffic Data Model items, are: Map, Node, Street, Link, Centroid, Event, etc. |
|
idno |
Numeric identifier associated with the item. |
| Id | Alpha-numeric identifier associated with the item. |
| = | Equal sign. |
| value | Value associated with the item in the current configuration. |
Examples:
| Command expressions | Description |
|---|---|
| Map | It opens a new map. |
| show Nodes idno=1 | It opens a new map with details related to the Nodes layer, focusing on a Node identified by idno=1. |
| add Events | It opens a new map with an Events layer. |
|
Layer: KPI |
It opens the current map with a KPI layer added to the list of the active layers. |
In this area, you can select a set of layers and add them to the map.
| Icon | Layer | It shows data on... |
|---|---|---|
|
|
(→ Air Quality Maps layer) | The air quality of your area, detailing on the distribution and concentration of its relevant pollutants. |
|
|
(→ Centroids layer) |
Centroids, which are a logical entity that represents a volume of entities (users, cars, etc...) related to a specific zone of the map. |
|
|
The controllers network. |
|
|
|
(→ Count Locations layer) |
All the sensors placed in the network and stored in Traffic Supervisor. |
|
|
(→ Estimated Traffic layer) |
Forecast information - with a specific forecast delay time - provided by a set of selectable data sources. |
|
|
(→ Events layer) | Real-time traffic events occurring on the network. |
|
|
(→ Harmonized Traffic Measurements layer) | Harmonized traffic data of the network. |
|
|
The Key Performance Indicators which are configured for your current instance of TS. |
|
|
|
(→ Links layer) |
The links of the network. A link is made up of a sequence of streets. |
|
|
(→ Machine Learning Forecast layer) | Traffic forecast data which are obtained through machine learning. |
|
|
The quality of real-time forecast results provided by the Machine Learning Forecast engine. |
|
|
|
(→ Harmonized Traffic Measurements layer) |
The volume of traffic measured on the network. Different data providers can send information to the Optima server. |
|
|
The quality of real-time forecast results - provided by the TRE engine - compared to real measurements. |
|
|
|
The quality of real-time forecast results - provided by the TRE engine - compared to those produced during the calibration of the model. |
|
|
|
(→ Nodes layer) |
The node locations of the network. |
|
|
(→ Parkings layer) |
Parking locations. |
|
|
Public transport lines. |
|
|
|
Public transport stops where people can have access to public transport vehicles. |
|
|
|
The position of public transport vehicles on the map. |
|
|
|
(→ Scenarios layer) | Your simulated scenarios. |
|
|
(→ Scenario Results layer) | Your scenario simulations results. |
|
|
(→ Shared Vehicles layer) | The availability of shared vehicles on the network. |
|
|
A set of controllers grouped under a signal coordination group. |
|
|
|
(→ Streets layer) |
The streets network of your area. |
|
|
(→ TMC Locations layer) |
The Traffic Message Channel table locations. At lower zoom levels, the layer displays the location name of each point. |
|
|
(→ Traffic Emission Measurements layer) | Measured or estimated traffic emission levels. |
|
|
(→ Traffic Measurements layer) |
Speeds that are measured on the network. Different data providers send information to the Optima server. |
|
|
Variable Message Signs placed on the street network (related to the Optima database). |
|
|
|
(→ WebCams layer) |
Web cam locations. |
Important: Depending on your installation of Traffic Supervisor, some layers may not be available in the Layers Library list.
To add a layer to the map, (→ Setting layers as active).
Alternatively, you can drag and drop a layer from Layers Library to Active Layers.
A red counter is incremented when you add a new instance.
For more details on layers: (→ Working with layers).
This read-only area shows specific information according to the most recent layer added from the Layers Library list.
From the collapsible Toolbar 
you can choose several map operations.
| Icon | GUI Area |
|---|---|
|
|
It allows you to choose the base background layer for the map:
|
|
|
It allows you to establish a connection between two maps (see (→ Setting a connection between maps)). |
|
|
It allows you to pin or unpin a component. If you pin a component (for example, the pop-up window with the details of a data model entity), it opens in a separate window of the browser. When you unpin it, the component returns to the original container. |
|
|
It allows you to measure the distance between two points selected on the map. |
|
|
It opens or closes the collapsible bar. |
The instances of the layers represented on the map are listed in the Active Layers list.
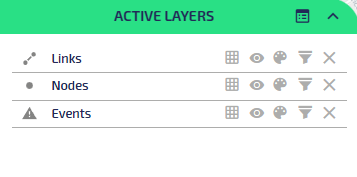
You can change the order of active layers by selecting a layer with a left-click and dragging it to the desired position.
Tip: The drag feature is enabled to allow for reordering as shown. For this reason, you can drag the layer around in the entire window but without any useful result.
When selecting a layer from the Active Layers list, you can choose different themes to represent the layer object on the map.
Important: If you close the browser window containing the Control Room Dashboard, all browser instances containing the associated maps are automatically closed.
Topics in this section