The Machine Learning Forecast Quality layer displays the quality of the real time forecast results provided by Machine Learning Forecast (MLF) engine, compared to the real measurements retrieved from the field.
On the map you can see the relative error of forecast measurements vs current real measurements.
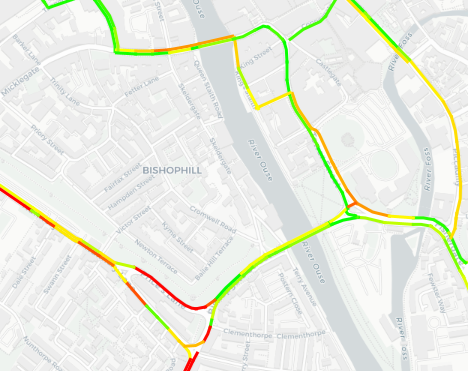
The associated KPI measures this relative error. An increased KPI means an increasing relative error, that is, a traffic forecast showing worsened traffic conditions than the real-time situation.
The KPI can be focused on speed or flow, in accordance with your selection on the LAYER OPTIONS panel.
| Info type | Description |
|---|---|
|
|
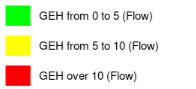
If you have selected flow in the LAYER OPTIONS panel, on the map you see a KPI based on the Geoffry E. Havers (GEH) formula. If the KPI color is GREEN, the relative error between forecast measurements and current real measurements is low or 0 (for an ideal forecast, GEH=0). The relative error increases as the colors shift from GREEN to YELLOW to RED. |
|
|
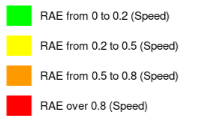
If you have selected speed on the LAYER OPTIONS panel, on the map you see a KPI based on the Relative Absolute Error (RAE). The RAE coincides with SFQI index (see → Forecast Quality Indicators (FQI)). If the KPI color is GREEN, the relative error between forecast measurements and current real measurements is low or 0 (for an ideal forecast, RAE=0). The relative error increases as the colors shift from GREEN to YELLOW, ORANGE to RED. |
| Option type | Description |
|---|---|
| Forecast |
It allows you to choose the time interval (in minutes) for your forecast. Tip: The duration of the interval is set according to the configuration of your Optima instance. The layer displays traffic forecast data according to the selected value. |
| Value Type |
It allows you to get a forecast related to:
|
- Click on a street (or link) to open the pop-up window with detailed information about the attributes.
The selected street (or link) is colored with a purple bold line.
![]()
- Select the layer in the ACTIVE LAYERS list.
- Click the
 List icon.
A pop-up window with a list of items opens. Every item represents a street (or link), which is characterized by a set of attributes.
Other operations are available for the layer (→ Operations on layers).