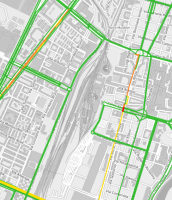
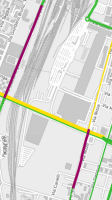
The Estimated Traffic layer displays the "estimated" traffic data.
The estimated data is collected from different data providers.
These data providers can be selected from the LAYER OPTION area.
You can select:
- One provider
- All the providers at once
The data is used to get the measurement of the ratio V/V0, which gets associated to a specific color.
The different colors represent different partitions of the V/V0 ratio.
V is the speed, while V0 is the free flow speed - that is, the speed that you can reach on a specific street or link without traffic constraints (free flow).
| Info type | Description |
|---|---|

|
Traffic flow is heavily blocked. |

|
Traffic flow proceeds slowly. |

|
Traffic flow is almost smooth. |

|
Traffic flow is smooth. |

|
Traffic flow proceeds at very high speed, very close to the limit of V0. |
| Option type | Description |
|---|---|
| Theme |
It allows you to choose one of a set of graphic themes to represent the layer entities. |
| Displayed Simulation |
It allows you to choose a data provider from the set of available providers. |
| Forecast |
It allows you to choose a forecast delay time. The layer displays the estimated traffic data according to the selected value. For example, if you choose the value 00:45:00, the layer displays the situation of the estimated traffic after 45 minutes. The set of available values depends on the configuration provided by Short-Term Forecast. |
- Select the layer in the ACTIVE LAYERS list.
- Click the
 List icon.
A pop-up window with a list of items opens. Every item represents a street (or link) which is characterized by a set of attributes.
Other operations are available for the layer (→ Operations on layers).

