The Traffic Measurements layer displays real-time traffic data.

The real-time data registered by different sensors is not harmonized through some criteria. Rather, the measurements are directly collected by different data providers.
You can indeed choose one of two data visualization modalities by using the Trafficstate Type list menu in the LAYER OPTION area. These two modalities are:
- Data collected by one provider only
- Data collected by all providers at once.
The data is used to get the measurement of the ratio V/V0, which gets associated to a specific color.
The different colors represent different partitions of the V/V0 ratio.
V is the speed, while V0 is the free flow speed - that is, the speed that you can reach on a specific street or link without traffic constraints (free flow).
| Info type | Description |
|---|---|
|
|
V or V0 not available. |
|
|
The traffic flow is heavily blocked. |
|
|
The traffic flow proceeds slowly. |
|
|
The traffic flow is almost fluid. |
|
|
The traffic flow is fluid. |
|
|
The traffic flow proceeds at very high speed, that is, very close or higher than V0. |
 V or V0 not available
 V/V0 <= 10%
 10% <V/V0 <= 25%
 25% <V/V0 <= 50%
 50% <V/V0 <= 75%
 V/V0 > 75%
| Option type | Description |
|---|---|
| Theme |
It allows you to choose one of a set of graphic themes to represent the layer entities. |
| Traffic State Type |
It allows you to choose a data provider from the set of available providers. If you select ---, the maps shows data from all providers at once. The set of available values depends on how your Optima instance is configured. |
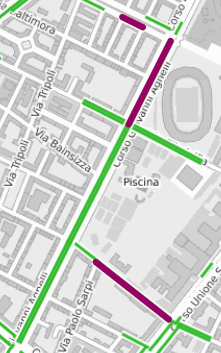
- Click on a street (or link) to open the pop-up window with detailed information about the real speed attributes.
The selected street (or link) is colored with a purple bold line.
- Select the layer in the ACTIVE LAYERS list.
- Click the
 List icon.
A pop-up window with a list of items opens. Every item represents a street (or link) which is characterized by a set of attributes.
Other operations are available for the layer (→ Operations on layers).