The Key Performance Indicator (KPI) layer displays the value of a KPI.
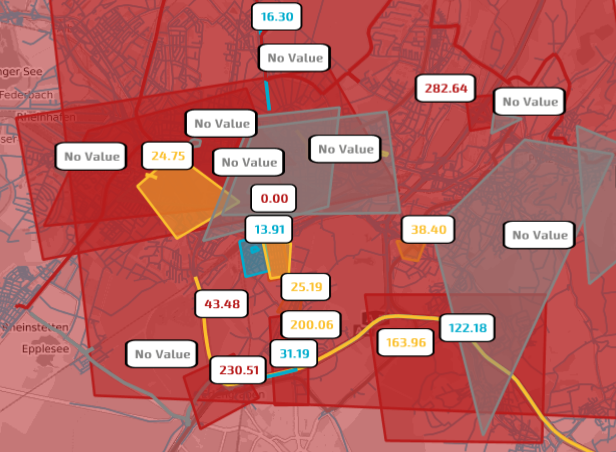
A KPI provides a measurement of some parameter of the Traffic Data Model managed by TS.
For example, you can build a KPI on:
-
The number of active speed detections.
-
The total length of queues, measured as [Km].
- The percentage of public transport runs with a delay.
Click a KPI icon to open a pop-up window listing the attributes of the KPI.
According to the zoom level, a single icon can group two or more "real" KPIs.
In this case, before showing the list of attributes, a pop-up window opens to select the specific KPI from the list associated with the icon.
Tip: You can get the same result through the operation (→ Showing a selected item).
A KPI is usually characterized by two threshold values, TR1 and TR2 (TR1<TR2).
These values have to be correlated with a KPI property, named Improving Direction, that provides you with indications about the evolution of the KPI.
The value of the KPI (KPIV), related to the values of TR1 and TR2, determines the "quality" of KPIV, as per the LAYER INFO table:
| Info type | Description |
|---|---|
|
|
KPIV cannot be determined. |
|
|
KPIV<TR1 if the KPI property Improving Direction is set to INCREASING. KPIV>TR2 if the KPI property Improving Direction is set to DECREASING. |
|
|
TR1<=KPIV<=TR2 |
|
|
KPIV>TR2 if the KPI property Improving Direction is set to INCREASING. KPIV<TR1 if the KPI property Improving Direction is set to DECREASING. |
Important: The meaning of the numeric value of a KPI depends on the specific type of KPI represented on the map.
| Option type | Description |
|---|---|
|
Layer Theme |
It allows you to choose a set of graphic themes to represent the layer entities. |
|
Provider |
It allows you to choose one of the available providers:
Important: When you set a specific provider, on the map you see ONLY KPIs associated to that provider. The provider that you set here IS NOT CORRELATED with the forecast engine that can be selected in the FORECAST MONITOR widget (→ Control Room dashboard). |
|
Map KPIs shape |
It allows you to choose a shape to represent a KPI on the map:
|
|
Map KPIs filter |
It allows you to choose a specific KPI filter. The selected filter is displayed on the map. The filters can be set through the operation (→ Adding a KPI filter). |
- Select the layer in the ACTIVE LAYERS list.
-
In the LAYER OPTION area, click ADD.
The Edit pop-up window opens.
-
Run the procedure → Adding a KPI.
The new KPI filter is added to the list of available filters in the LAYER OPTION area.
- Select the layer in the ACTIVE LAYERS list.
- In the LAYER OPTION area, select the KPI from the Map KPIs filter combo-box.
-
Click on the KPI displayed on the map.
The Edit pop-up window opens.
- Click DELETE.
- Select the layer in the ACTIVE LAYERS list.
- In the LAYER OPTION area, select the KPI from the Map KPIs filter combo-box.
-
Click on the KPI displayed on the map.
A pop-up window opens.
- Click EDIT.
- Edit the attributes associated with the KPI filter.
- Click SAVE.
- Select the layer in the ACTIVE LAYERS list.
- In the LAYER OPTION area, select the KPI from Map KPIs filter combo-box.
-
Click on the KPI displayed on the map.
A pop-up window opens.
- Click CLONE.
- In the KPI Name text area, update the name of the cloned KPI filter.
- Edit the attributes associated with the cloned KPI filter .
- Click SAVE.
- Select the layer in the ACTIVE LAYERS list.
- In the LAYER OPTION area, select the KPI from the Map KPIs filter combo-box.
-
Click on the KPI displayed on the map.
A pop-up window opens.
-
Click ADD TO DASHBOARD.
The ADD KPI WIDGET pop-up window opens.
- In the WIDGET area, select an available widget to be associated with the KPI you preset in the KPI area.
-
Click SAVE.
The new widget is displayed on the KPI Dashboard (→ KPI Dashboard workspace).
- Select a layer on the ACTIVE LAYERS list.
-
Click the
 List icon.
The List KPIs pop-up window opens.
- Filter the whole set of items (→ Filtering layer items), if necessary.
- Select one of the items of the list.
-
Click Show to get all the attributes associated to the selected KPI:
KPI attribute Description Real time
Boolean type.
-
true: if the Short Term Forecast (STF) engine updates the KPI value.
-
false: if the KPI is associated with a scenario that you can associate to a simulation group.
Simulation
Integer type.
The Simulation value matches the identifier of the simulation associated to the KPI.
Time
Last computation time of the KPI.
Value
Value of the KPI.
Normalized value
A normalized value in the range [0,1].
ID
Identifier of the KPI.
Name
Name of the template.
Description
Description of the template.
Template name
Name of the template.
Editable
Boolean type.
- true: the KPI instance derived from the KPI template is editable.
- false: Not editable.
Values with duration
Boolean type.
KPIs are calculated at discrete time and KPI values can be represented as distinct points on a chart (false).
- true: KPI values are shown on the chart as a segment of length defined as Validity duration.
- false: KPI values are shown on the chart as distinct points.
Validity duration
Real value.
It contains a value (in seconds) that is used only if Values with duration = true.
It specifies how long a point should persist over time (the length of the segment), therefore representing for how long the value of the KPI can be considered constant.
Values with duration = 1/simulation frequency.
If Values with duration is higher than 1/simulation frequency, you can see segments overlap. In the opposite case, it is possible to see a "jump" in the graphical representation.
Entity
String type.
A string to specify the type of entity associated with the KPI calculation.
Possible values:
- STREET
- LINK
- LINE_ROUTE
- STOP
Entity layer
Technical name of the layer associated with Entity. Provider ID
Identifier of the data provider associated with the KPI.
In the table you can see the list of available providers:
Provider ID Provider Name 1
optima-put
2
short-term-forecast
3
optima-harmonizer
4
machine-learning-forecast-quality
5
optima-planning
6
optima-micro
7
machine-learning-forecast
Type
String type.
A string representing the result type of the KPI.
Minimum
Minimum value of the KPI.
Maximum
Maximum value of the KPI.
Category
Sting type.
It contains a string to specify the category of the template.
A category is associated with a specific icon displayed on the GUI. An unknown category is associated with a default icon.
Category
Icon
QUALITY

KPI
PUT
ML Forecast
HARMONIZER
FLOW

QUEUE

SPEED

TRAVEL TIME

Direction of improvement
String type.
To understand if the current KPI value is better than the previous value, it is important to state if it is increasing (the higher value is better) or decreasing (the lower value is better).
Possible values:
- INCREASING: the computed value is better if it is high.
- DECREASING: the computed value is better if it is low.
Unit of measure
String type.
It contains the measurement unit (if it is defined) of the KPI.
Tags
String type.
It contains a list of comma-separated words - all being associated to a KPI instance.
Enabled
Boolean type.
- true: The KPI instance is enabled to be computed.
- false: Not enabled.
Quality thresholds
Thresholds are based on two real values that identify the limits (range) of the KPI value:
<min_value> and <max_value>.
The two values are used to define three regions and each region is associated with a specific Status.
Filters
The filter associated with the KPI (selectable from the list of available filters in the LAYER OPTION area).
Deleted
Boolean type.
A KPI result is deleted after you click the DELETE button on the ATTRIBUTES:KPI pop-up.
true: Optima implements a "soft delete" mechanism for KPIs, therefore you can still query deleted KPIs and check their historical data, but they won't appear on the map anymore.
false: Otherwise.
Status
Integer value used to map the "quality" of the KPI.
-
0 = Not applicable
-
1 = OK
-
2 = WARNING
-
3 = ALERT
-
4 = If Value has been computed but is not defined with any associated Quality thresholds.
Schedule interval (s)
Integer type.
A default value (measured in seconds) to schedule the KPI computation.
Forecast
Integer type.
It contains the forecast interval, expressed in seconds.
The possible values are:
- 0 (equivalent to the current forecast)
- 900 (15 minutes).
- 1800 (30 minutes).
- 2700 (45 minutes).
- 3600 (60 minutes).
-
- Select the layer in the ACTIVE LAYERS list.
- Click the List icon.
A pop-up window with a list of items opens. Every item represents a KPI, which is characterized by a set of attributes.
Other operations are available for the layer (→ Operations on layers).