The Centroids layer displays all centroid locations registered in the system.
A centroid is the logical representation of a "volume of intensity" for a specific attribute of the data model.
For example, the inhabitants of a specific area or the cars directed to a specific area.
The centroid is a sort of "logical gate" connected to a node of the network and represents the "entry point" towards the node (and also the "return point" from the node) of the considered quantity "volume".
For example: All the inhabitants of a district that in a certain time slot enter the traffic network.
It is not realistic to model and maintain an account of a single inhabitant. You can thus define a centroid that represents all of them (that represents the "volume" of inhabitants).
Caution: A centroid is not a geometric concept and it has nothing to do with the "barycenter" of the area.
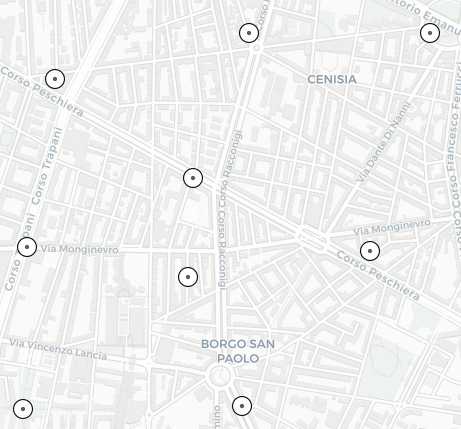
Click a centroid icon to open a pop-up window, listing the attributes of a centroid.
According to the zoom level, a single icon can group two or more "real" centroids.
In this case, before showing the list of attributes, a pop-up window opens allowing you to select from the list the specific centroid associated with the icon.
Tip: You can get the same result through the operation (→ Showing a selected item).
| Info type | Description |
|---|---|
| |
Graphical representation of a centroid. |
| Option type | Description |
|---|---|
| Theme | You can choose one of a set of graphical themes to represent the layer entities. |
| Filter |
You can choose one from a set of values to filter the data to be shown in the layer. |
- Select the layer in ACTIVE LAYERS list.
- Click the
 List icon.
A pop-up window with a list of items opens. Every item represents a centroid, which is characterized by a set of attributes.
Other operations are available for the Centroids layer (→ Operations on layers).