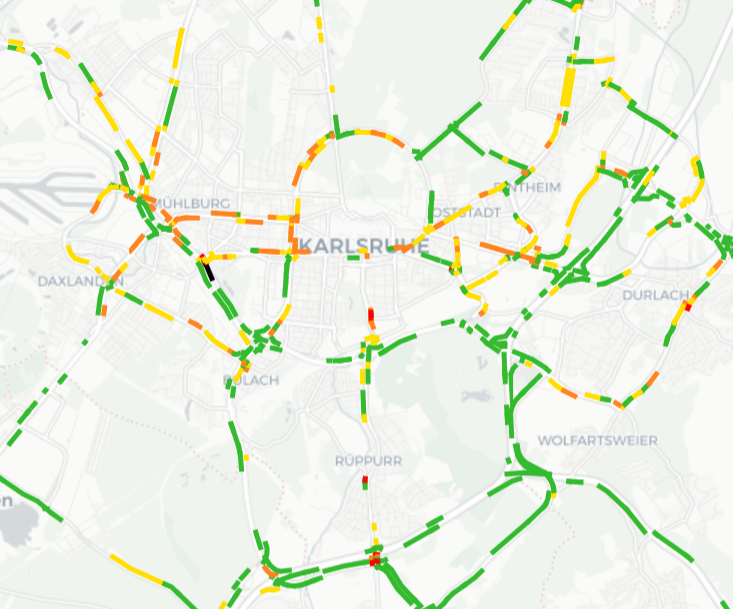
The Machine Learning Forecast layer displays traffic forecast data that is obtained through machine learning.
In the LAYER OPTION area, you can select the time interval covered by your forecast.
The data is used to get the measurement of the ratio V/V0, which gets associated to a specific color.
The different colors represent different partitions of the V/V0 ratio.
V is the speed, while V0 is the free flow speed - that is, the speed that you can reach on a specific street or link without traffic constraints (free flow).
| Info type | Description |
|---|---|
|
|
Traffic flow data is not available. |
|
|
The traffic flow is heavily blocked. |
|
|
The traffic flow proceeds slowly. |
|
|
The traffic flow is almost fluid. |
|
|
The traffic flow is fluid. |
|
|
The traffic flow proceeds at very high speed, that is, very close or higher than V0. |
 V/V0 N.D.
 V/V0 <= 10%
 10% <V/V0 <= 25%
 25% <V/V0 <= 50%
 50% <V/V0 <= 75%
 V/V0 > 75%
| Option type | Description |
|---|---|
| Forecast |
It allows you to choose the time interval (in minutes) for your forecast. Tip: The duration of the interval is set according to the configuration of your Optima instance. The layer displays the traffic forecast data according to the selected value. The set of available interval values depends on the configuration provided by Machine Learning Forecast. Example: If your configured interval is 15 minutes and you choose the value 00:45:00, the layer displays the traffic forecast data resulting for the interval starting after 30 minutes and lasting until 45 minutes after the present time. |
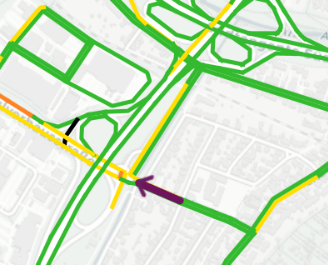
- Click on a street (or link) to open the pop-up window with detailed information about Machine Learning Forecast attributes.
The selected street (or link) is colored with a purple bold line.
- Select the layer in the ACTIVE LAYERS list.
- Click the
 List icon.
A pop-up window with a list of items opens. Every item represents a street (or link), which is characterized by a set of attributes.
Other operations are available for the layer (→ Operations on layers).