The Count Locations layer displays all static sensors of the network that are stored in the system.

The sensors can provide measurements of different parameters according to the nature of the sensor.
A typical measurement is the volume of the traffic flow.
Click a sensor icon to open a pop-up window containing the list of the attributes of a sensor.
In the listed attributes set, you can set the check-box:
| Attribute | Description |
|---|---|
|
Enable for forecast |
You can set:
The set value affects the forecast every time that Traffic Real-time Equilibrium (TRE) reloads it to understand if it should use the location data or not. Therefore, the effect of this set can be delayed for a time period defined as: [Tchange, Tload] With: Tchange: time of the option set value. Tload: time when TRE reloads the option's set value. |
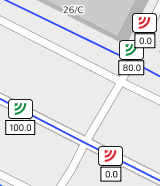
According to the zoom level, a single icon can group two or more "real" sensors.
In this case, before showing the list of attributes, a pop-up window opens to select the specific sensor from the list associated with the icon.
Tip: You can get the same result through the operation (→ Showing a selected item).
| Info type | Description |
|---|---|
|
|
The sensor is online and it can provide a measurement from the field. The status is considered OK unless the sensor sends a different status, overriding the default OK. |
|
|
The sensor is in a warning state. The meaning of this state can vary according to the type of sensor. |
|
|
The sensor is offline and it cannot provide a measurement from the field. |
|
|
The sensor is not receiving any information. |
|
|
The sensor is disabled and it is not providing any measurements. |


| Option type | Description |
|---|---|
|
Theme |
Allows you to choose a set of graphic themes to represent the layer entities. The selectable options are:
|
|
Enable for forecast |
You can set a filter to show:
|
On the map, only the locations that are matching the exact set of enabling options are shown (four possible combinations of YES/NO values).
| Chart button | Description |
|---|---|
| Flow |
It displays the traffic flow dimension. |
| Speed |
It displays the vehicle speed along a specific link or street of the traffic network. |
- Select the layer in the ACTIVE LAYERS list.
- Click the
 List icon.
A pop-up window with a list of items opens. Every item represents a count location, which is characterized by a set of attributes.
Other operations are available for the layer (→ Operations on layers).