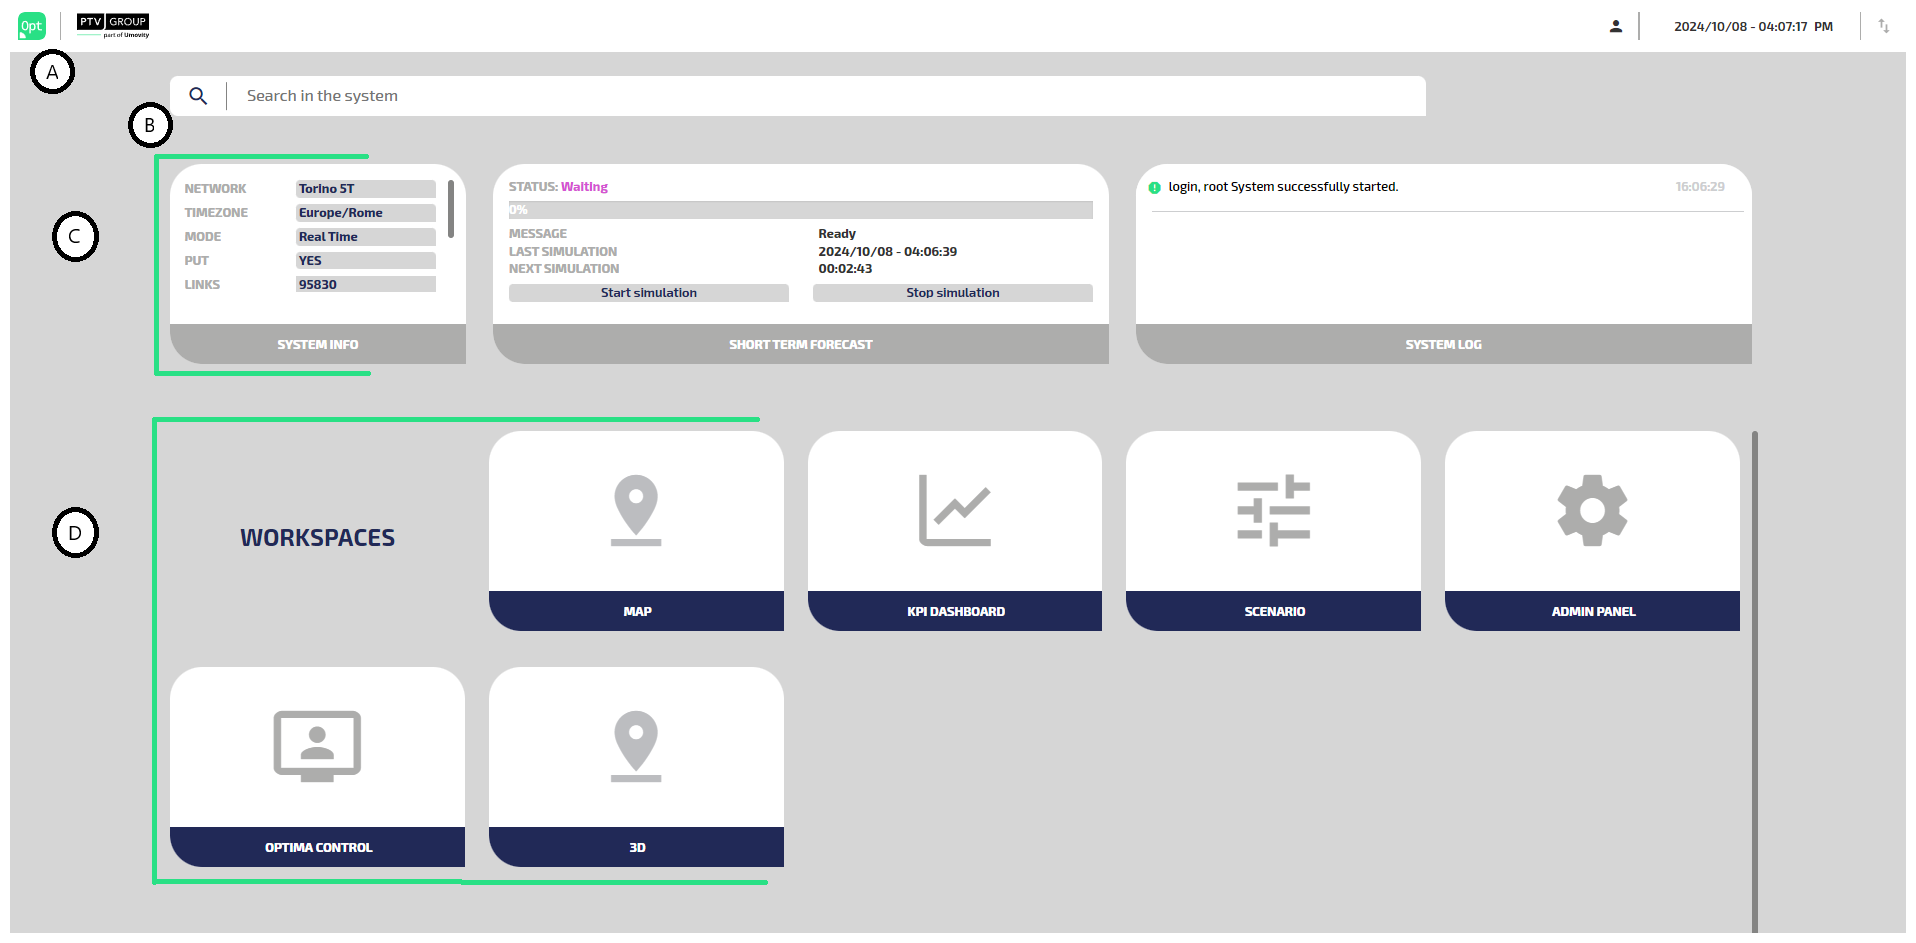
The Control Room Dashboard is the main window of Traffic Supervisor (TS).
It displays information and the controls of the Optima system.
The main four areas are associated to indicators A, B, C, and D.
| Indicators | GUI Area |
|---|---|
| A | Upper Bar |
| B | Search Bar |
| C | System Info Widgets |
| D | Workspaces |
| Items | Description |
|---|---|

|
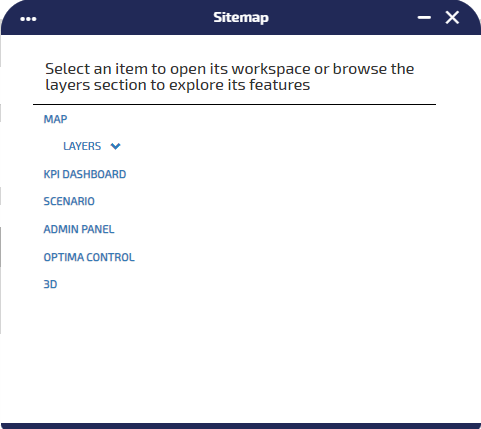
Click the PTV Optima logo to access three shortcuts:
|
|
|
Click the OptimaCompanion icon to access the chatbox. Companion is the intelligent assistant based on a Generative Artificial Intelligence engine, fed with Optima documentation material. Tip: This icon is only visible if the tag <hasChatbot>= true. See → Global configurations for more details.
|

|
Placeholder for customer logo. |

|
Detection and Control KPI list. The red bubble shows the number of active alerts associated through the Optima Detection and Control module (→ Optima Detection and Control (ODC)). Click the bell icon to access the list of alerts (→ KPI alerts). |
|
Administration area |
Click
|
|
Calendar area |
It displays the date in local format. If you click on a date, you can associate a day type to a specific set of dates (or to a single date). See → Associate a day type to a date (to a set of dates). |
|
Connection area |
Click
|
The Search Bar allows you to search for traffic model items stored in the system.
It is also possible to use specific commands to perform detailed searches or operations, using an appropriate command-line syntax.
The main syntax expressions are as follows:
- item
- command item [{idno|Id} = value]
- Layer : item
| Command items | Description |
|---|---|
|
command |
The values for this parameter are: add, show, open, etc. |
|
item |
The values for this parameter, which is related to the Traffic Data Model items, are: Map, Node, Street, Link, Centroid, Event, etc. |
|
idno |
Numeric identifier associated with the item. |
| Id | Alpha-numeric identifier associated with the item. |
| = | Equal sign. |
| value | Value associated with the item in the current configuration. |
Examples:
| Command expressions | Description |
|---|---|
| Map | It opens a new map. |
| show Nodes idno=1 | It opens a new map with details related to the Nodes layer, focusing on a Node identified by idno=1. |
| add Events | It opens a new map with an Events layer. |
|
Layer: KPI |
It opens the current map with a KPI layer added to the list of the active layers. |
The System Info Widgets includes a set of contextual information provided by the PTV Optima server system.
| Widget | Information |
|---|---|
|
SYSTEM INFO |
It displays a subset of information related to the main elements of the network. The properties shown in this area are configured in the file: /opt/ptv-optima-as/standalone/configuration/optima/optima-configuration.xml In particular, see → Global configurations:
Important: Only the Optima Administrator can configure these properties. |
|
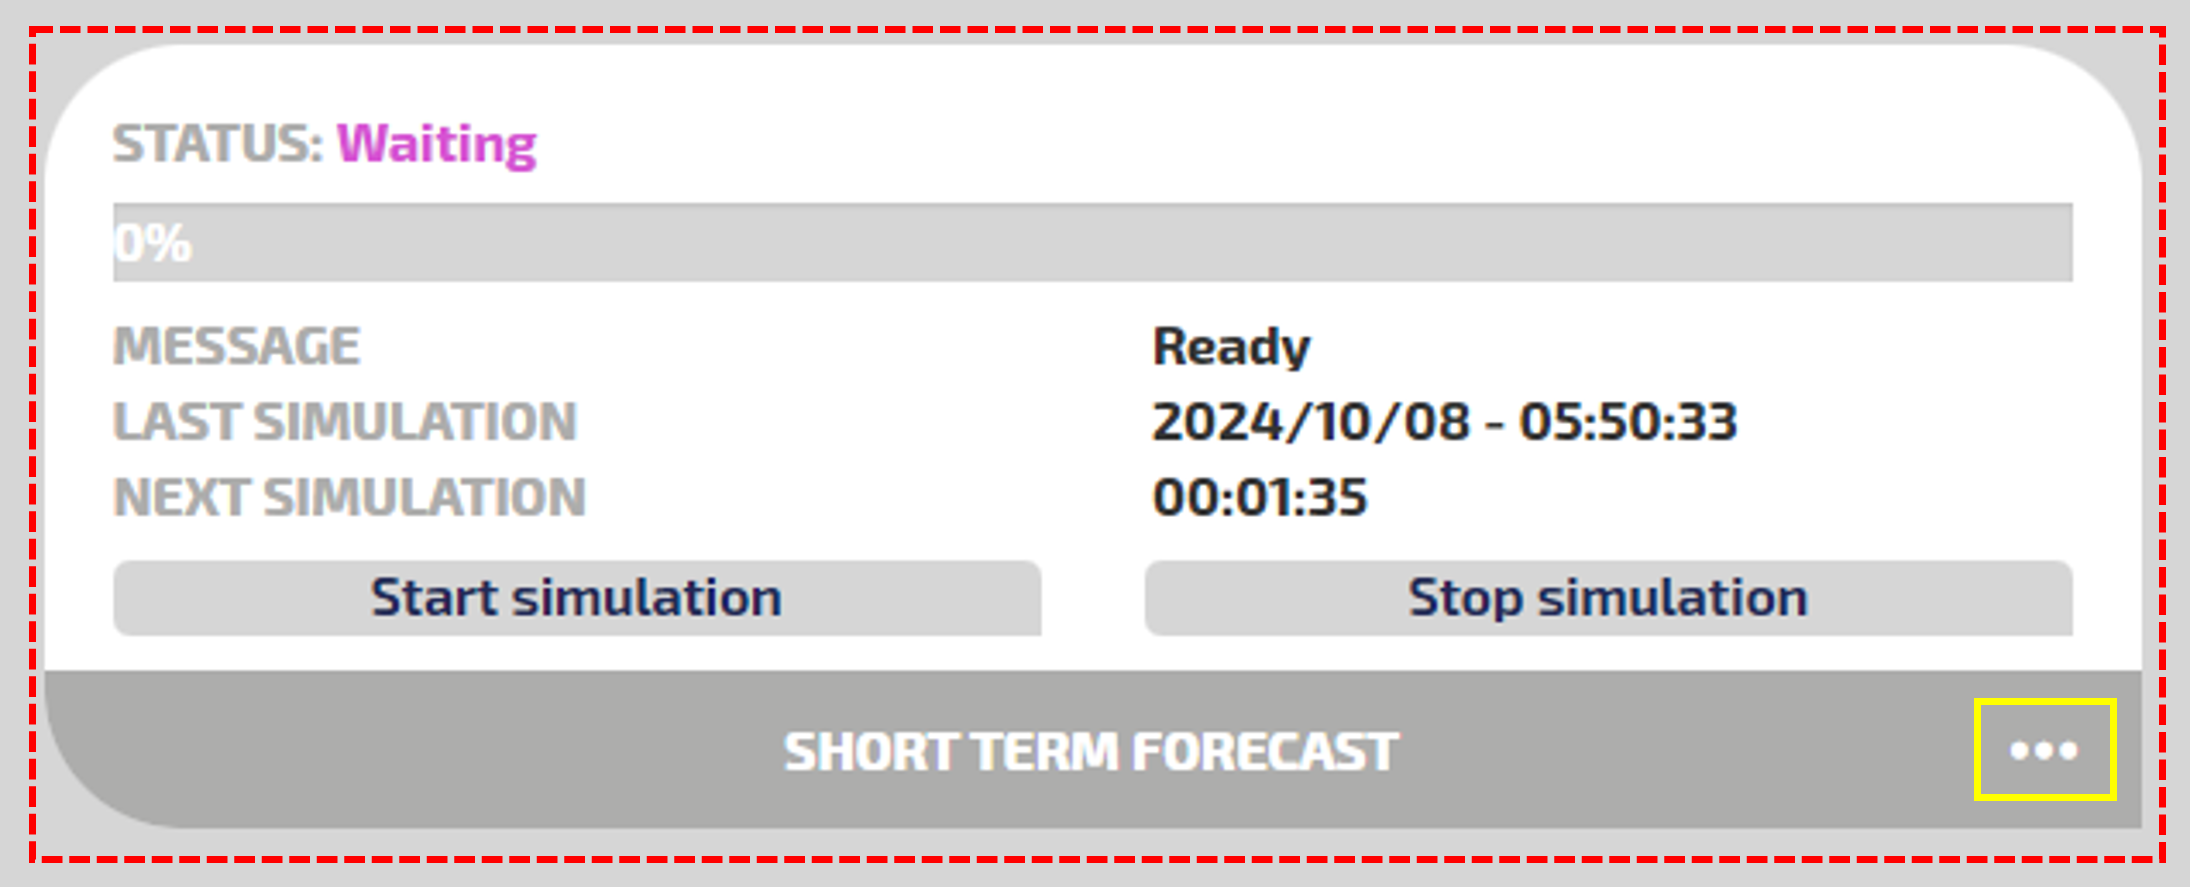
FORECAST MONITOR |
It displays information about the current status of the simulation engine. You can choose the simulation engine by clicking on the "three dots" icon (see the red circle):
A progress bar shows the status of the simulation. Click Start Simulation to open a new simulation and add it to the request queue (server side). Click Stop Simulation to block the current simulation. The list contains the available values for the status:
Start Simulation displays the date of the last completed simulation - or a new simulation - that is added to the request queue (server side). |
|
SYSTEM LOG |
It displays information on events logged by PTV Optima system to help the operator to manage the running system. |

The WORKSPACES area allows you to access different components of TS through a set of widgets.
Important: Click a widget to open the corresponding component in a new browser window. You must configure your browser to allow for pop-up windows to open in order to use this feature.
| Widget | Description |
|---|---|
|
MAP |
Container of traffic layers displaying the main elements of the TS data model (→ Traffic Map and Layers). |
|
KPI DASHBOARD |
It allows you to set specific graphic representations for one or more Key Performance Indicators (KPIs) (→ KPI Dashboard workspace). |
|
SCENARIOS |
It allows you to define a new scenario, that is a set of events that can define a "test" environment where you can replicate the evolution of the system under certain conditions. |
|
ADMIN PANEL |
The Optima administration console allows you to perform administrative tasks, like registering the credentials of a new user (→ OptimaWSI administration dashboard). |
Important: If you close the browser window containing the Control Room Dashboard, all browser instances containing the associated active workspaces are automatically closed.