KPI Dashboard workspace
The Key Performance Indicators (KPI) dashboard displays mainly a set of KPI “widgets”.
A widget hosts a graphical representation of a specific KPI.
Different graphical representations can be used, depending on the nature of each KPI (→ KPI Widgets).
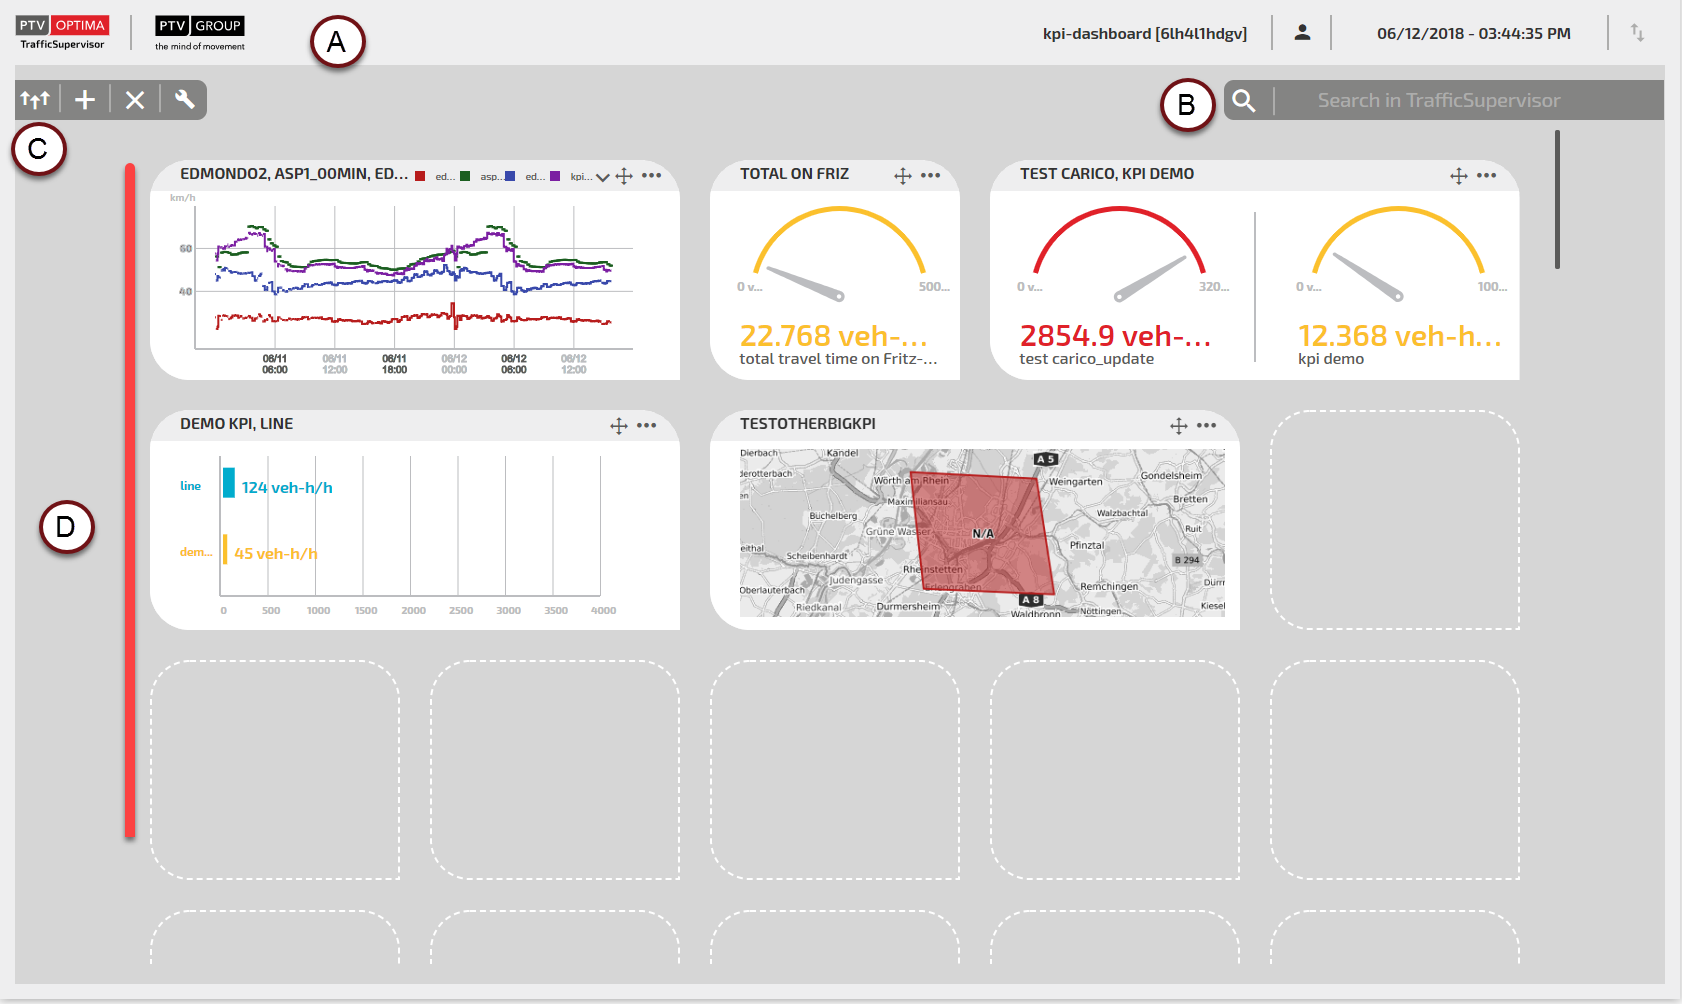
The main four areas of the KPI Dashboard can be described as follows (see the respective markers A, B, C, D):
| Indicators | GUI Area |
|---|---|
|
A |
Upper Bar |
|
B |
Search Bar |
|
C |
Widgets Toolbar |
|
D |
Widgets Workspace |
| Items | Description |
|---|---|

|
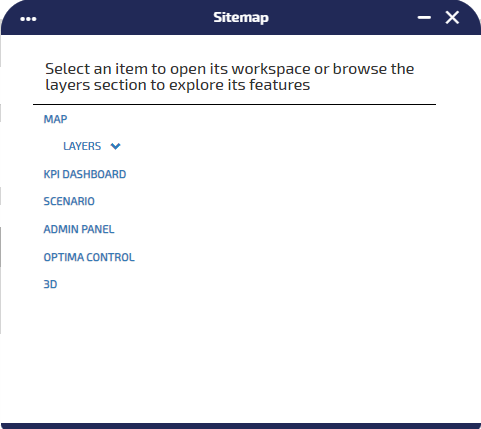
Click the PTV Optima logo to access three shortcuts:
|
|
|
Click the OptimaCompanion icon to access the chatbox. Companion is the intelligent assistant based on a Generative Artificial Intelligence engine, fed with Optima documentation material. Tip: This icon is only visible if the tag <hasChatbot>= true. See → Global configurations for more details.
|

|
Placeholder for customer logo. |

|
Detection and Control KPI list. The red bubble shows the number of active alerts associated through the Optima Detection and Control module (→ Optima Detection and Control (ODC)). Click the bell icon to access the list of alerts (→ KPI alerts). |
|
Administration area |
Click
|
|
Calendar area |
It displays the date in local format. If you click on a date, you can associate a day type to a specific set of dates (or to a single date). See → Associate a day type to a date (to a set of dates). |
|
Connection area |
Click
|
Through the Search Bar you can search for traffic model elements stored in the system.
You can use specific commands for a detailed search or for performing operations by using an appropriated syntax.
The main syntax expressions are as follows:
- item
- command item [{idno|Id} = value]
- Layer : item
| Command items | Description |
|---|---|
|
command |
The values for this parameter are: add, show, open, etc. |
|
item |
The values for this parameter, which is related to the Traffic Data Model items, are: Map, Node, Street, Link, Centroid, Event, etc. |
|
idno |
Numeric identifier associated with the item. |
| Id | Alpha-numeric identifier associated with the item. |
| = | Equal sign. |
| value | Value associated with the item in the current configuration. |
Examples:
| Command expressions | Description |
|---|---|
| Map | It opens a new map. |
| show Nodes idno=1 | It opens a new map with details related to the Nodes layer, focusing on a Node identified by idno=1. |
| add Events | It opens a new map with an Events layer. |
|
Layer: KPI |
It opens the current map with a KPI layer added to the list of the active layers. |
From the collapsible Widgets Toolbar 
you can choose several operations.
| Icon | Description |
|---|---|
|
|
Push up the widgets. If the current widgets are too scattered in the Widgets Workspace area, you can group them. |
|
|
Add a KPI widget. |
|
|
Delete all KPI widgets. A pop-up window opens to confirm the choice. |
|
|
Open or close the collapsible toolbar. |
Several operations are available to manage KPI instances and KPI widgets.
- Open the KPI Dashboard.
-
Click an empty space of the Widgets Workspace (mouse hover on an empty space and the
 symbol appears).
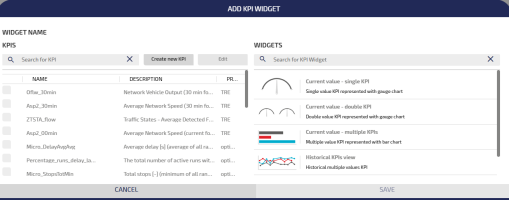
The ADD KPI WIDGET pop-up window opens.
-
Click Create new KPI.
-
Run the procedure → Adding a KPI.
Tip: The KPI added is listed in the KPIs frame.
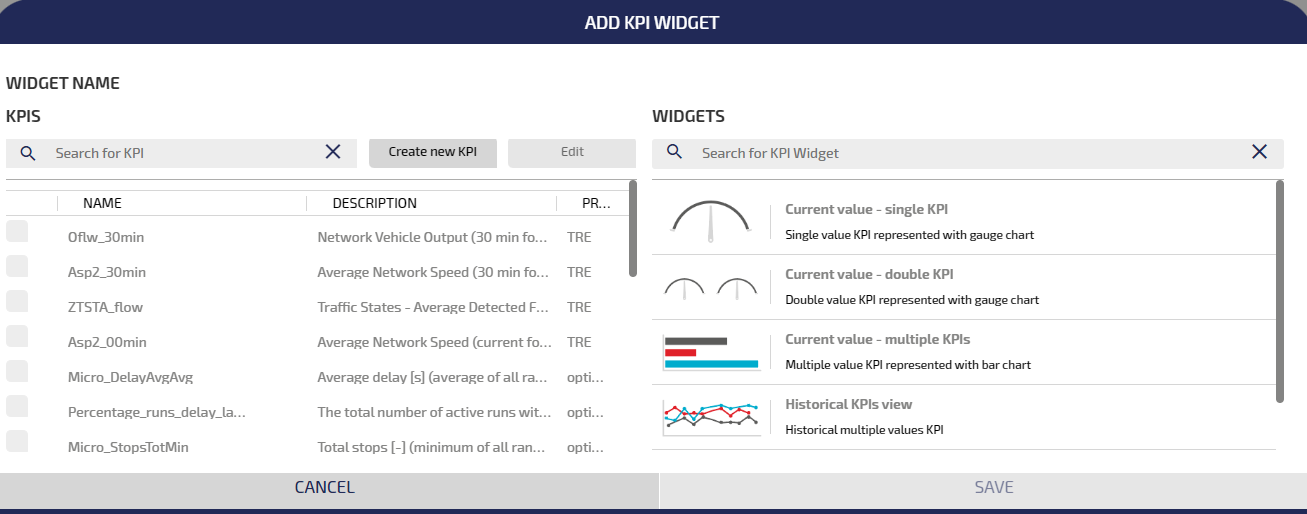
You can add a KPI widget to the KPI Dashboard, starting from a list of preset KPIs.
Important: A specific KPI can be associated with different widgets. A selected widget can also host different KPIs.
- Open the KPI DASHBOARD.
-
Click an empty space of the workspace (mouse hover on an empty space and the
symbol appears).The ADD KPI WIDGET pop-up window opens.
-
In the WIDGET NAME text area, insert the name of the new KPI widget.
-
The KPIS area lists the available KPI.
Tip: If the list hosts a high number of items, you can use the search engine to find the right KPI.
- Select one or more KPIs.
-
According to the selection expressed in the previous step, in the WIDGETS area you can select the available widgets.
Tip: In the WIDGETS list you can select ONLY the widget types that are compatible with the nature of the KPIs (at least one) selected in step 5.
-
Click SAVE.
The KPI Dashboard opens and the new widget is added.
Tip: You can also select a widget in the WIDGETS area. According to your selection, only a subset of compatible KPIs are now selectable in the KPIS area.
Important: If you close the browser window containing the Control Room Dashboard, all browser instances containing the associated KPI widgets are automatically closed.
Topics in this section