TS offers a wide set of layers (→ Working with layers).
The layers are built dynamically from the information stored in the file:
/opt/ptv-optima-vv.n.xxxxptv-optima-as/standalone/configuration/optima/optima-configuration.xml.
A layer is described through a JSON object.
The JSON object is identified by the name of the layer, followed by the string "JSONCONF":
<LayerName>JSONCONF
{
 "property1": "value1",
 "property2": "value2",
 "property3": {"param1": "value1", "param2": "value2",..., "paramK": "valueK"}
...
 "propertyN>: "valueN"
}
</LayerName>
The JSON object contains a list of properties, with the corresponding values, that determine the behavior and the structure of the layer.
Some properties can be described by a set of parameters (in the example, property3).
An example of JSON object, related to the Link layer:
<Link>JSONCONF
{
 "geoserverLayer": "link",
 "treeDir": "layerNetwork",
 "filterFunction": "linkFnod",
 "featureStyle": "arrow",
 "popupOptions": { "popupClass": "TS.View.LinkPopup", "useExtJS": true },
 "hasStylesCombo": true,
 "featuresDetailColumns" :["idno", "tail", "head", "name", "leng", "nlan", "capa", "sped"],
}
</Link>
Important: You can add a layer or update the properties of an existing layer by opening the file optima-configuration.xml and adding a JSON object (or modifying an existing one). It is not necessary to stop the system server that hosts the file /optima-configuration.xml.
The set of TS layers, thus the set of JSON objects, is placed in the tag <configuration>/<TrafficSupervisor>/<layers> of the file optima-configuration.xml.
The table lists all the parameters that can be used to build a JSON object representing a layer:
|
Property |
Type |
Description |
||||||||||||||||||||||||||||||||||||||||||||||||||||||||||||||||||||||||||||||||||||||||||||||
|---|---|---|---|---|---|---|---|---|---|---|---|---|---|---|---|---|---|---|---|---|---|---|---|---|---|---|---|---|---|---|---|---|---|---|---|---|---|---|---|---|---|---|---|---|---|---|---|---|---|---|---|---|---|---|---|---|---|---|---|---|---|---|---|---|---|---|---|---|---|---|---|---|---|---|---|---|---|---|---|---|---|---|---|---|---|---|---|---|---|---|---|---|---|---|---|---|
|
showLayerOnGUI |
Boolean |
This parameter determines if the layer can be shown over the TS map.
|
||||||||||||||||||||||||||||||||||||||||||||||||||||||||||||||||||||||||||||||||||||||||||||||
|
cqlFilterCombos |
Object |
It contains the description of a combo box with a set of selectable values, specified in the possibleValues array. You can add N combo-boxes to any layer, therefore you can define N arrays possibleValues that are in logical AND. The parameters of the property are:
|
||||||||||||||||||||||||||||||||||||||||||||||||||||||||||||||||||||||||||||||||||||||||||||||
|
defaultStyleName |
String |
It contains the name of the default style used to render the layer. The style must be a valid GeoServer style contained in a specific list. For example: "defaultStyleName": "ts3_pointGraph_2" |
||||||||||||||||||||||||||||||||||||||||||||||||||||||||||||||||||||||||||||||||||||||||||||||
|
detailsDisplay |
Object |
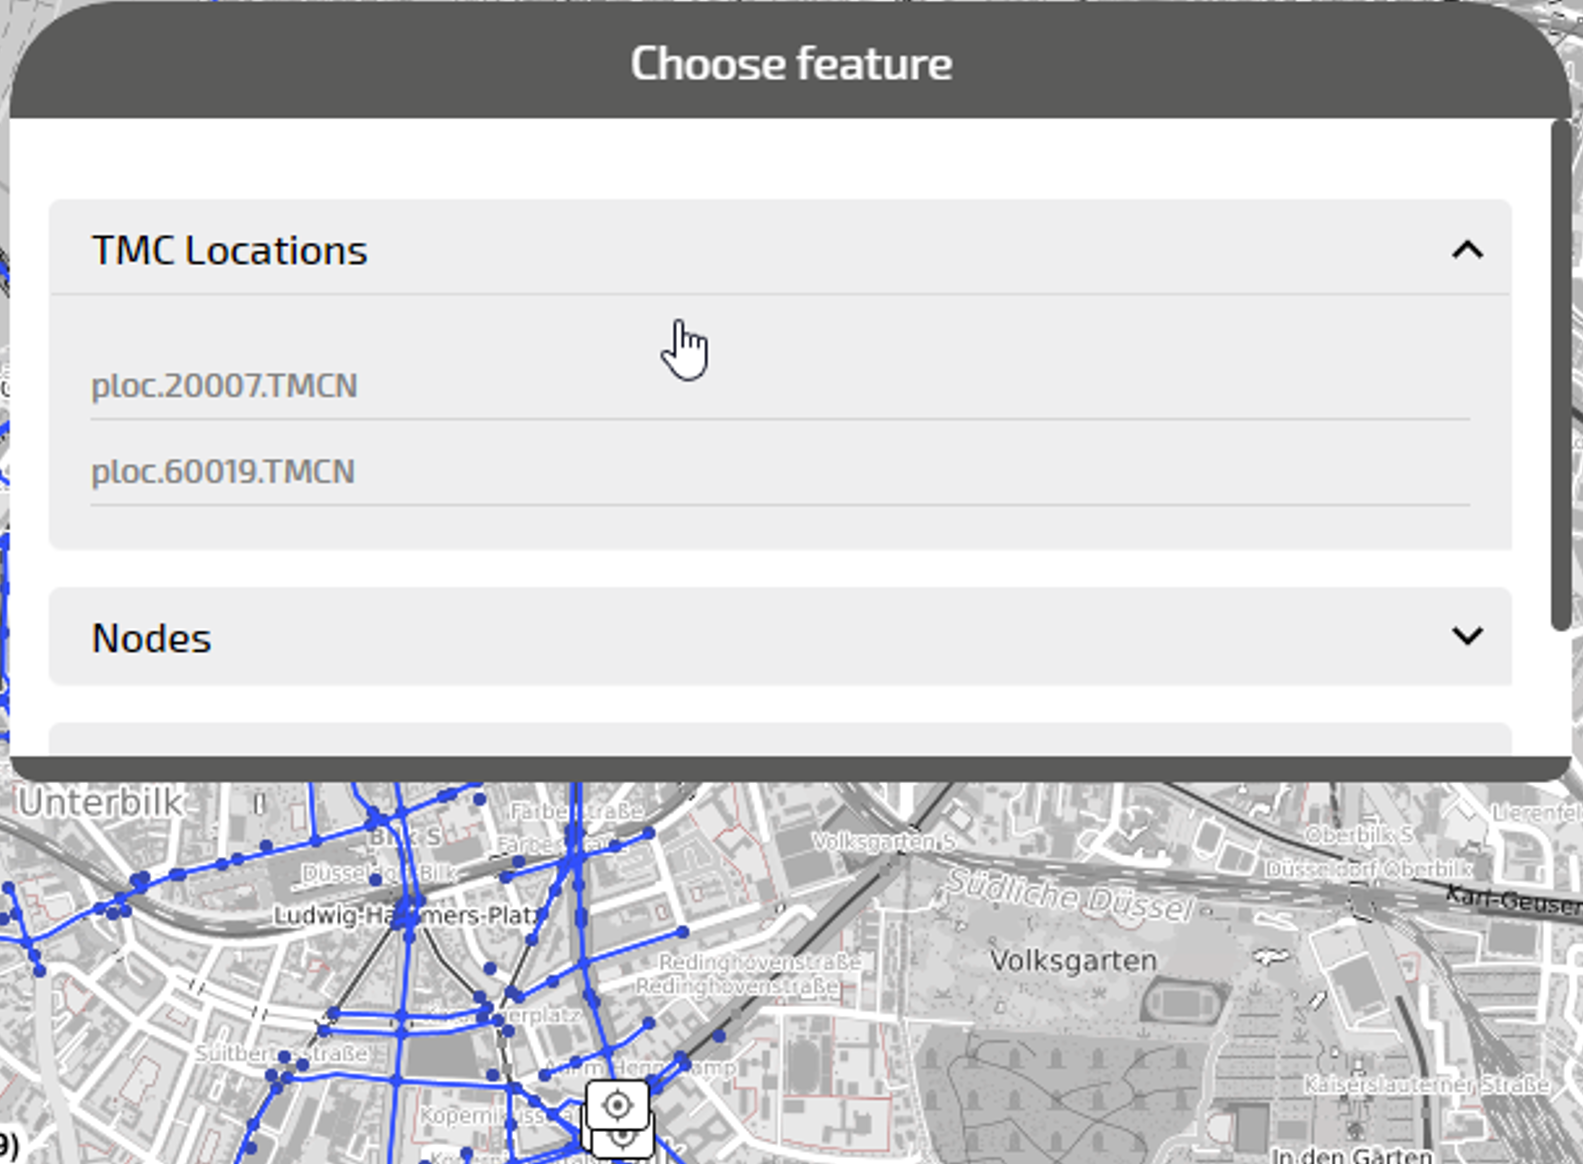
It contains an array of labels to identify a subset of the featuresDetailColumns set. The property is used to disambiguate elements contained in the pop-up Choose feature.
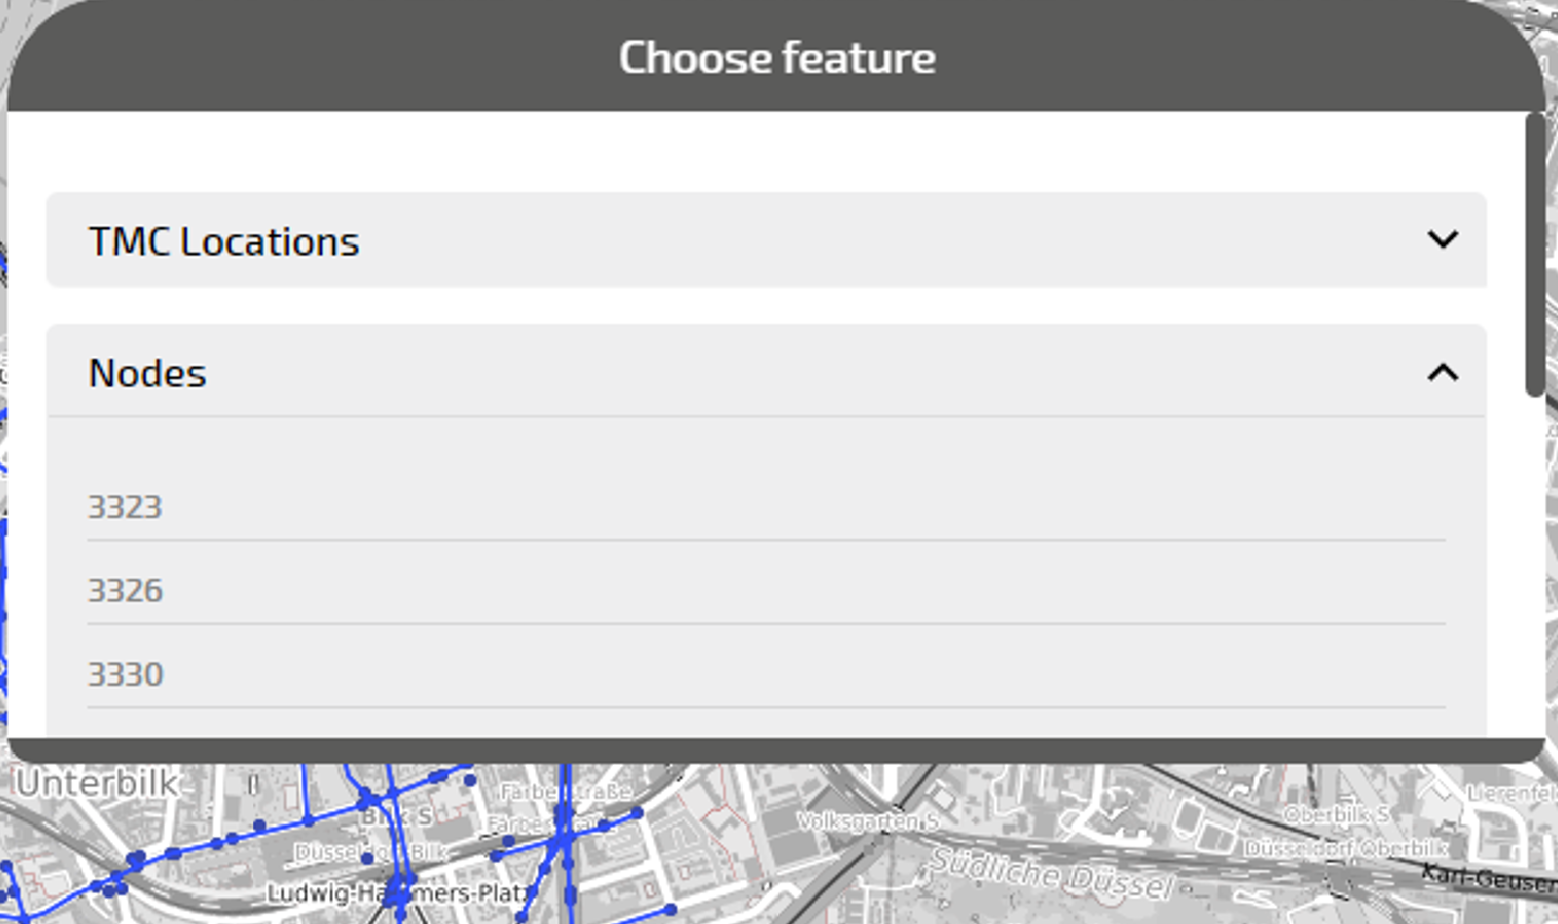
In the Choose feature pop-up, you see two elements with unfriendly technical names. The information shown are associated to the JSON for TMC Locations layer, where the property is not set: In the next example, the layer Nodes contains the property detailsDisplay associated to an array of two elements, ["idno", "mnod"].
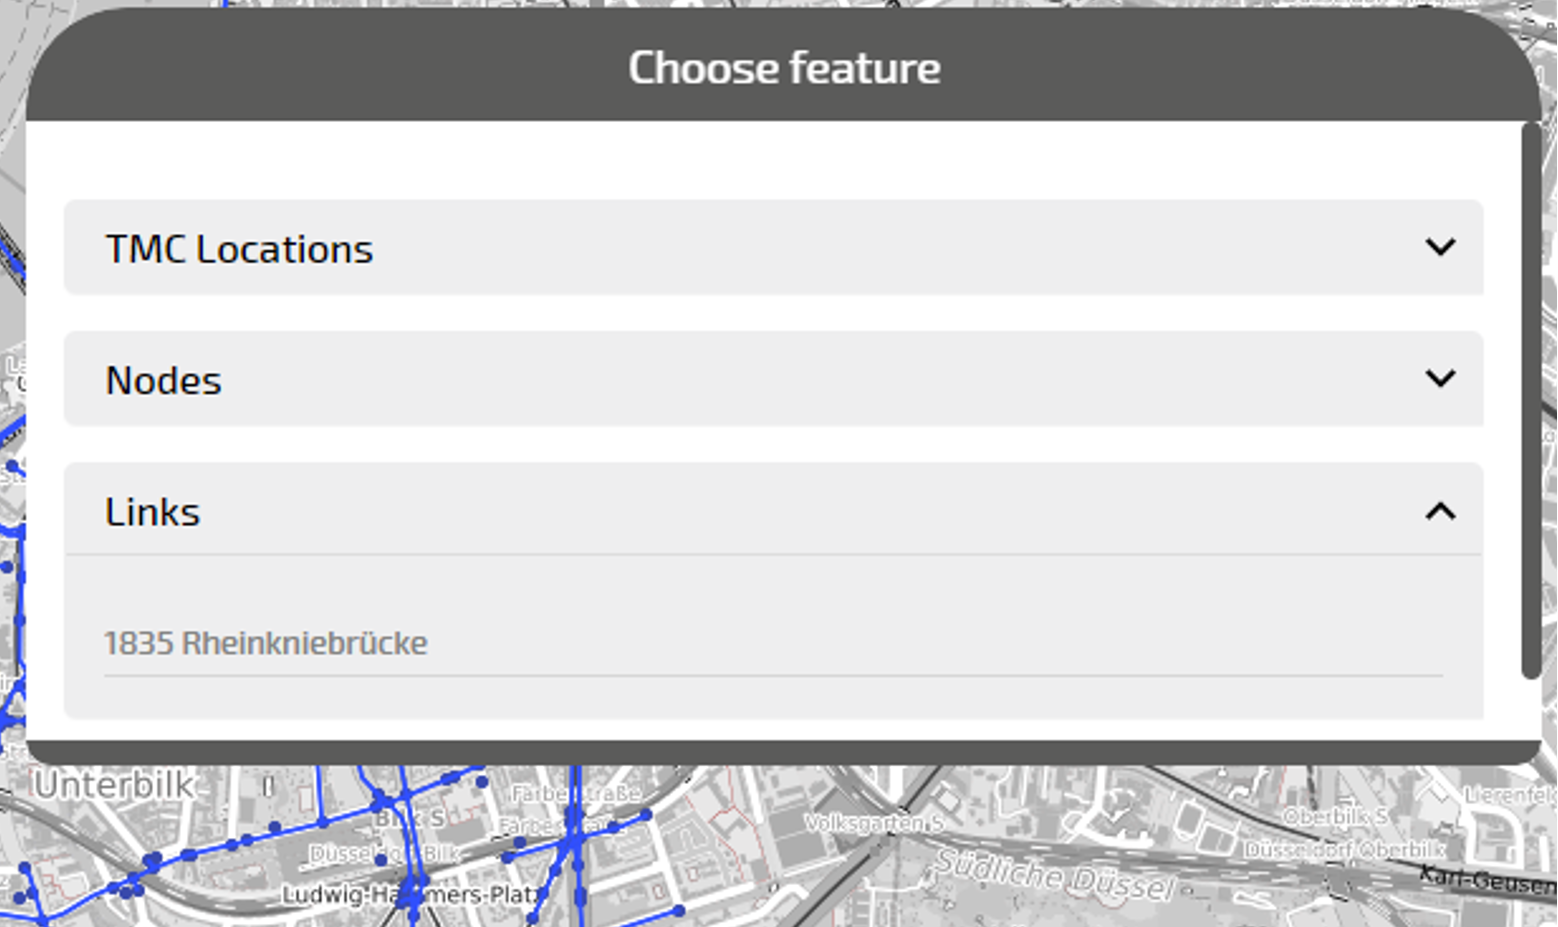
In the Choose feature pop-up, you see three nodes identified by their identifier number (idno). Information on main nodes is absent (mnod=null) for all nodes. In the next example, the layer Link contains the property detailsDisplay associated to an array of two elements, ["idno", "name"].
In the Choose feature pop-up, you see one link identified by its identifier number (idno) and name. The string is composed of: "idno"+" "+"name" The policy associated to detailsDisplay is:
|
||||||||||||||||||||||||||||||||||||||||||||||||||||||||||||||||||||||||||||||||||||||||||||||
|
featureDetailsColumns |
String |
It contains an array of strings related to the columns displayed in the feature pop-up associated to the layer. For example: "featuresDetailColumns" :["idno", "head", "name", "sped"] The strings used to populate the array are stored in GeoServer (→ OptimaWSI administration dashboard). |
||||||||||||||||||||||||||||||||||||||||||||||||||||||||||||||||||||||||||||||||||||||||||||||
|
featureStyle |
String |
It contains a string identifier to draw a specific object:
|
||||||||||||||||||||||||||||||||||||||||||||||||||||||||||||||||||||||||||||||||||||||||||||||
|
filterFunction |
String |
When you click on the map, different features may be returned. These different features are related to the "density of information" of the area where you click. The density of information varies according to several factors, for example:
The available values are:
|
||||||||||||||||||||||||||||||||||||||||||||||||||||||||||||||||||||||||||||||||||||||||||||||
|
geoserverLayer |
String |
It contains the name of the GeoServer layer. |
||||||||||||||||||||||||||||||||||||||||||||||||||||||||||||||||||||||||||||||||||||||||||||||
|
layerStyleTitleField |
String |
It contains a Geoserver style property (for example,"Abstract") used to render the style selection information. The style property "Abstract", if used within the configuration of a layer, overrides the value "Title" set for layerStyleTitleField here → layersStyleTitleField. Example: In the table you can see the mapping between "Title" and "Abstract":
|
||||||||||||||||||||||||||||||||||||||||||||||||||||||||||||||||||||||||||||||||||||||||||||||
|
pollingInterval |
Integer |
It contains the refresh time period, in seconds. Any number > 0. |
||||||||||||||||||||||||||||||||||||||||||||||||||||||||||||||||||||||||||||||||||||||||||||||
|
popupOptions |
Object |
It contains a JSON hash describing the pop-up features details, according to the parameters:
|
||||||||||||||||||||||||||||||||||||||||||||||||||||||||||||||||||||||||||||||||||||||||||||||
|
selectionFilterFunction |
String |
It currently manages only one value, comboFilter. |
||||||||||||||||||||||||||||||||||||||||||||||||||||||||||||||||||||||||||||||||||||||||||||||
|
selectionFilterOptions |
Object |
It contains a configuration hash of selectionFilterFunction. |
||||||||||||||||||||||||||||||||||||||||||||||||||||||||||||||||||||||||||||||||||||||||||||||
|
Object |
It contains a JSON object where you can mainly configure:
Example: In the common case (2 thresholds and 3 colors), according to the level L of pollutant registered by the sensor, TS shows an icon of a varying color:
This concept is generalized if n thresholds and n+1 colors are specified:
Example: In the example, for the pollutant CO_3_CORR we have set:
Important: The colors are expressed according to the common notation (#xxxxxx) of the standard RGB. For geoserverLayer, featuresDetailColumns, defaultStyleName, and systemInfo, see the associated descriptions provided in this table. The property dataMocked is used for back-end side debugging and you can ignore it. The property projectId must be set by the project owner, and is associated to the API connecting the sensors: therefore, it is project-specific. In the example, pep1109 is a placeholder. |
|||||||||||||||||||||||||||||||||||||||||||||||||||||||||||||||||||||||||||||||||||||||||||||||
|
Object |
It contains a JSON object where you can mainly configure:
Every block of configuration is composed by the following properties:
Any specific threshold is associated to a specific color code. The heatmap colors are calculated according to these values. The intensity of the color on the map is set according to the concentration of the pollutant. Important: The colors are expressed according to the common notation (#xxxxxx) of the RGB standard. When you install Optima, a default configuration based on nine pollutants is available and ready to be used. You can modify the default values as you prefer, as shown in the example where only two channels are specified. Example: |
|||||||||||||||||||||||||||||||||||||||||||||||||||||||||||||||||||||||||||||||||||||||||||||||
|
systemInfo |
Boolean |
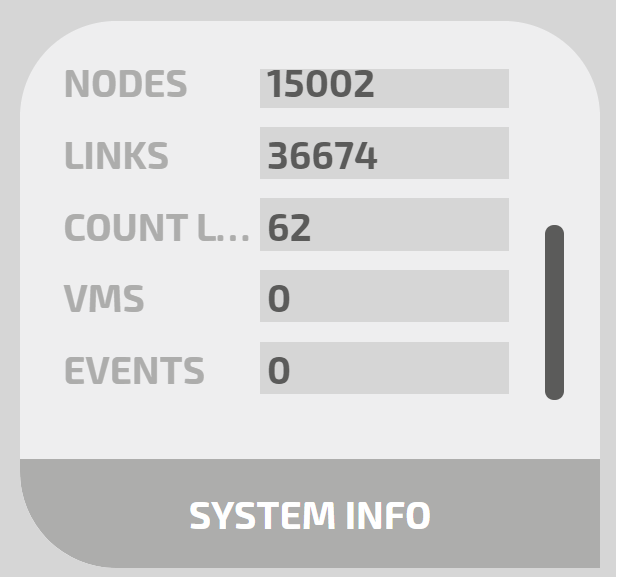
This parameter determines if the layer information is shown in the TS widget SYSTEM INFO.
Example:
See also → Control Room Dashboard > C - System Info Widgets. |
||||||||||||||||||||||||||||||||||||||||||||||||||||||||||||||||||||||||||||||||||||||||||||||
|
viewParamCombos |
Object |
It contains the description of a combo box with a set of selectable values, specified in the possibleValues array. You can add N combo-boxes to any layer, hence you can define N arrays possibleValues that are in logic AND. This property allows you to pass a specific parameter to an SQL query. To use this property you must:
The parameters of the property are:
For example: |
||||||||||||||||||||||||||||||||||||||||||||||||||||||||||||||||||||||||||||||||||||||||||||||
|
webSocketTopicName |
String |
It contains the identifier of the web socket associated to the layer. The identifier must match with jms-topic name present in: /opt/ptv-optima-vv.n.xxxxptv-optima-as/standalone/configuration/standalone.xml. The web socket manages the queue of updates of the data layer. For example: "webSocketTopicName": "optima_kpi" |
||||||||||||||||||||||||||||||||||||||||||||||||||||||||||||||||||||||||||||||||||||||||||||||
|
wfsGridColumns |
Object |
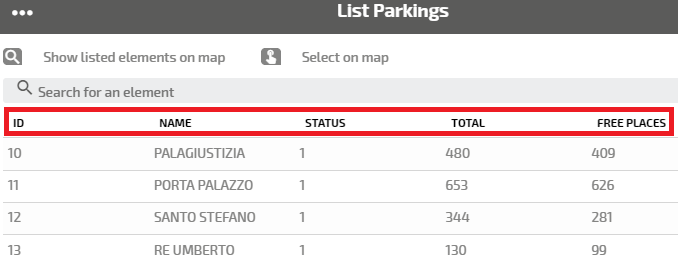
It contains an array of labels to identify the columns displayed in the List layer name pop-up window (see → Showing a selected item). For example:
The set of labels involved are associated to a set of columns determined by:
For example:
|
Important: You can define a layer also by using only a subset of the parameters in the table.
Topics in this section