PTV Optima uses state-of-the-art models and algorithms for the dynamic simulation of road traffic, allowing for offline and real-time estimations and forecasts of time-varying travel times, traffic flows and vehicle queues.
PTV Optima is deployed within a project and it consists of an OFFLINE preparation part and an ONLINE application in real-time.
The OFFLINE part consists of the construction and calibration of a transport demand model, the so-called base model. This base model uses historical data and represents the traffic behavior and conditions of typical days in the respective area.
The ONLINE part uses the base model and combines it with measurements from the field, information on accidents, traffic management strategies etc. This input is used in real-time to automatically turn the “typical day” into the “current day”.
The illustration outlines this approach:
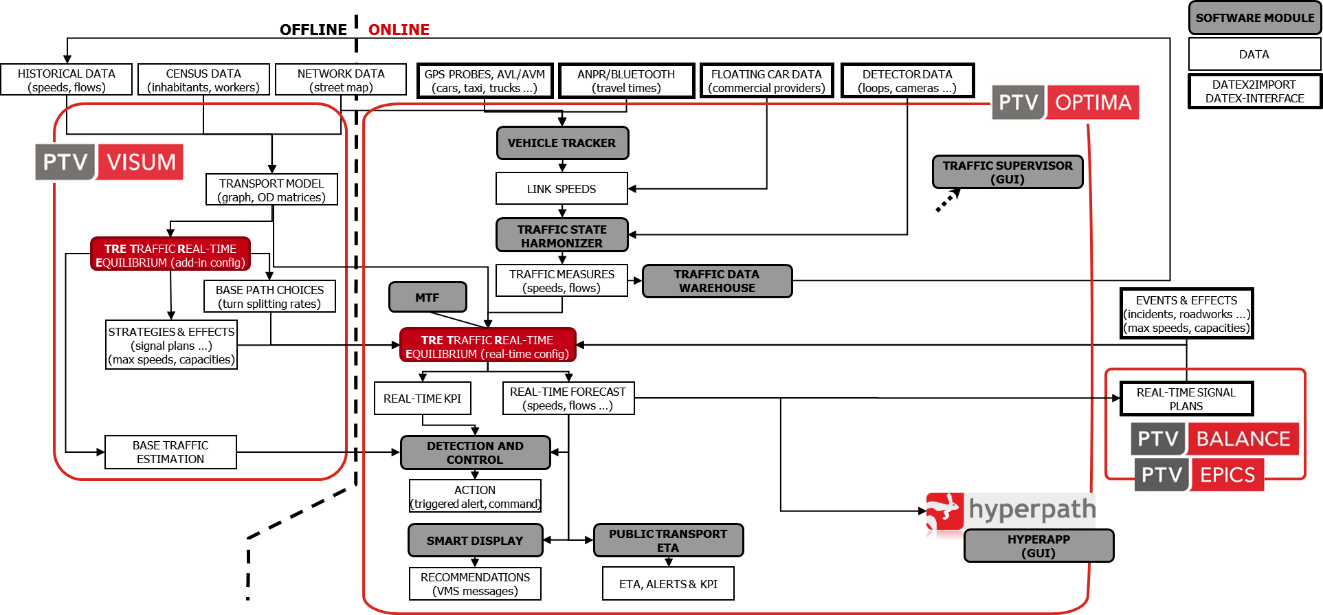
Illustration 1: PTV Optima: scheme of the functional architecture.
Take note that:
- BOLD text represents a software module in the PTV Optima platform.
- ITALIC text represents a data source or a data-model element.
- REGULAR text represents a dominion.
In the OFFLINE part there is the description of the supply, such as the NETWORK DATA, and the demand, for example OD matrices, both calibrated with HISTORICAL DATA. This is typically done for different day types (for instance, the typical working day or the typical weekend).
The information included in the OFFLINE part is corrected in the ONLINE part by real-time traffic data sources:
- GPS PROBES and Automatic Vehicle Location (AVL / AVM) data, coming from single vehicles, commercial fleets or public bus fleets etc. This allows for the derivation of speeds or travel times.
- Travel times derived from the AUTOMATIC NUMBER PLATE RECOGNITION (ANPR) / BLUETOOTH based on detectors.
-
Speed measurements FLOATING CAR DATA (FCD) from commercial providers, such as:
- TomTom (see → TomTom Interface).
- Inrix (see → INRIX Interface).
- HERE (see → HERE Interface).
- Roadside DETECTOR DATA delivering traffic counts (flows) and/or speeds.
In the ONLINE dominion, the TRE results are REAL-TIME FORECASTS in terms of speeds, flows, and queues on all links of the network for time intervals covering a forecast of typically up to 60 minutes.
The base TRANSPORT MODEL is built in PTV Visum. This preparation step is essentially the standard use case of PTV Visum, with the addition of specific preparations for PTV Optima. It is possible to update an existing PTV Visum demand model for PTV Optima or to create a new model from scratch.
Within this step, NETWORK DATA , CENSUS DATA and HISTORICAL DATA are used to build and calibrate the base model.
For more details, see → Modeler’s Guide.
The base model uses dynamic traffic assignment TRE (an add-in configuration). TRE in a different configuration is also the simulation engine of PTV Optima in the ONLINE part.
With respect to the OFFLINE part, TRE calculates how, over the course of 24 hours of a day, the demand is distributed within the network.
The results are called BASE PATH CHOICES and BASE TRAFFIC ESTIMATION, describing turn rates and traffic states over time. These two are the processed results that are transferred from the OFFLINE part to the ONLINE part.
In the ONLINE part (real-time configuration), several sources can impact on TRE, like:
- TRAFFIC MEASURES (for example, measured flows or speeds).
- EVENTS & EFFECTS (for example, unplanned accidents).
- REAL-TIME SIGNAL PLANS (for example, different traffic signal programs).
- STRATEGIES & EFFECTS.
The ONLINE configuration of TRE can run several “scenario simulations” in parallel, each with a different set of active STRATEGIES & EFFECTS.
In this case, PTV Optima becomes a decision support tool for real-time traffic management.
Strategies need to be previously prepared, as in the case of the base model, but can be combined in real time in any combination and simulated in parallel to the base simulation as additional scenarios.
For operational planning activities, TRE also allows you to model, test and prepare control and management operations STRATEGIES & EFFECTS.
For more details, see → Traffic Real-time Equilibrium (TRE).
VEHICLE TRACKER processes GPS data. It uses an online map-matching procedure in order to calculate measured speeds on the links of the network.
For more details, see → Vehicle Tracker.
TRAFFIC STATE HARMONIZER completes the traffic data pre-processing by merging all observed measures into comprehensive TRAFFIC MEASURES (flow and/or speed) on the links of the network.
For more details, see → Harmonizer.
MTF covers the forecast for the rest of the current day until the next couple of days. MTF is a specific configuration of TRE and, for the sake of simplicity, the MTF box in the illustration is not fully connected.
For more details, see → Mid-Term Forecast (MTF).
The TRAFFIC MEASURES corrects the online simulation provided by TRE (real-time configuration).
This configuration of TRE does not simulate the 24 hours of a typical day, but runs in a rolling horizon mode. In this mode, a simulation typically covers the next 60 minutes: its starting state is defined by the previous simulation, while its starting time continuously moves forward in real-time and is corrected by TRAFFIC MEASURES.
For more details, see → Traffic Real-time Equilibrium (TRE).
DETECTION & CONTROL allows for the definition of customizable triggers and alerts based on REAL-TIME FORECAST or BASE TRAFFIC ESTIMATIONS. For instance, it is possible to create an alert for the traffic operator if the travel time along a specific route is longer than the typical travel time.
For more details, see → Detection and Control.
TRAFFIC SUPERVISOR is the GUI of PTV Optima that allows you to analyze and control the full scope of PTV Optima.
For more details, see → About Traffic Supervisor.
OPTIMA API provides a wide set of APIs that allow for the integration of its functionality with several third-party traffic information systems.
For more details, see → API and IO Reference.
OPTIMA MICRO provides traffic forecasts for the sub-networks which are typically a smaller selection of the large-scale Optima model, based on a large-scale city or a state.
The micro-simulations are an additional decision support tool for high-quality traffic management decisions which are based on:
- The current traffic state collected and aggregated by PTV Optima (from detectors, FCD, etc.)
- The simulation results from PTV Optima - also considering the large-scale network traffic situation, including the events causing a spillback effect inside the subnetwork area.
OPTIMA MICRO is a "fine-grained" tool that allows you to isolate specific situations as:
- Link-blocking events, producing queues, spillback and local re-routing.
- Lane-blocking events (for example, a lane of a multi-lane road due to an accident).
- Link speed events, that might cause changes to the allowed speed limit along a link.
- Evaluation of different signal programs, such as traffic management actions.
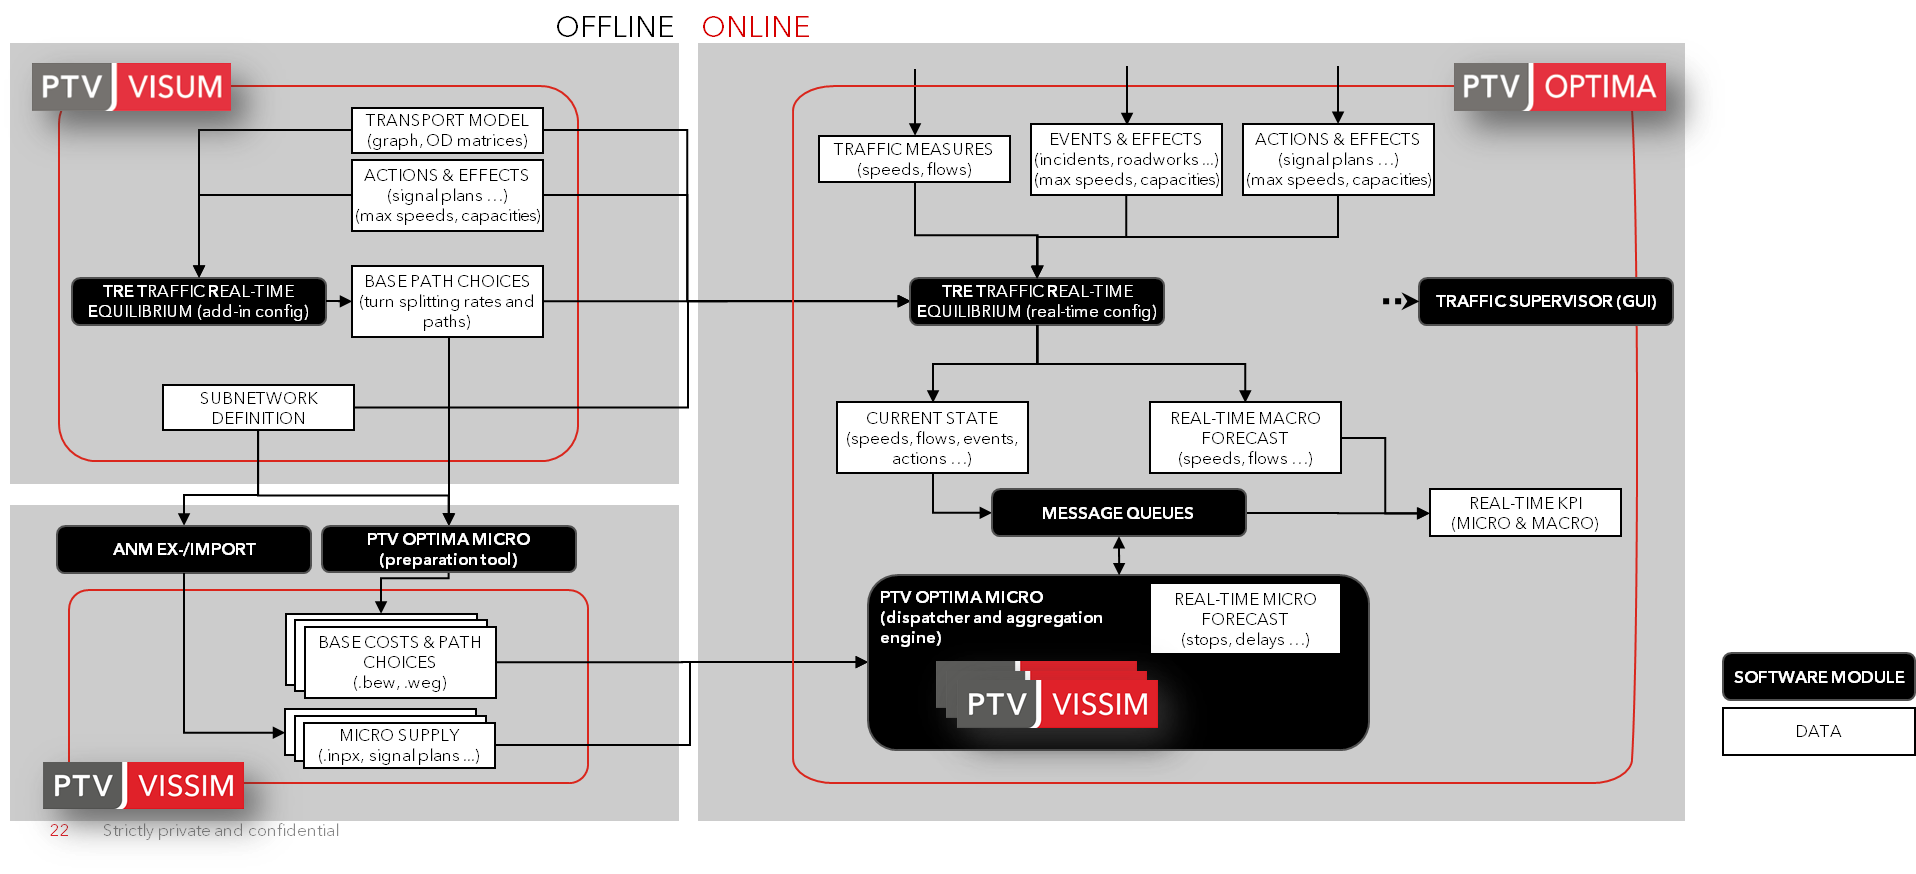
The left side of the image above (OFFLINE) outlines the model building in PTV Visum (upper section, the same as any PTV Optima project) and PTV Vissim (lower section).
The right side of the image above (ONLINE) outlines the data used associated to the offline preparation process and the data flow within the operational environment.
The PTV Visum model is calibrated offline in order to replicate the evolution of demand and path choices throughout a typical day.
The resulting base path choices, demand, graph and actions available for the online application are transferred to the operational online environment. In the online area, the real-time configuration of TRE re-simulates the typical day under the influence of measured real-time data sources.
In the same manner, the typical day from PTV Visum and the resulting assignment are the basis for cutting the routes and their demand through the PTV Vissim subnetworks of the larger PTV Visum model.
The resulting base costs and paths (in the form of .weg/.bew files), the networks and signal programs are transferred to the online operational environment.
As in the real-time configuration of TRE, PTV Optima Micro re-simulates the typical day subnetwork using PTV Vissim and is influenced by measured real-time data sources.
For more details about:
- Modeling, see → Modeling Optima Micro.
- Methodology and configuration, see → Optima Micro.
PUBLIC TRANSPORT ETA addresses the needs of a multi-modal ITS system. It uses real-time positions of public transport vehicles and the REAL-TIME FORECASTS of TRE in order to calculate estimated times of arrival (ETA).
The module can also calculate and forward connection alerts and public transport KPIs. This helps to improve the service quality of connected systems like, for example, a public transport operations control center.
For more details, see → Public Transport ETA.
SMART DISPLAY provides recommendations for the content of a Variable Message Sign (VMS).
For more details, see → Smart display (API reference).
Key Performance Indicators (KPIs) are scalar measurements to assess several characteristics:
- Of the traffic network in real time.
- Of the simulated scenarios.
Examples of KPIs:
- The average speed along a road.
- The total queue length in a specific part of the city.
For more details, see → Optima KPI.
In the ONLINE dominion, TRE results are REAL-TIME FORECASTS, in terms of speeds, flows and queues on all links of the network for time intervals covering a forecast of typically up to 60 minutes.
These forecasts can be used in various ways:
- The forecasts of flows can be forwarded to a signal optimizer. At the same time, the returned optimized signal plans are fed into the simulation of PTV Optima, improving the forecast.
- The forecasts can feed into the PUBLIC TRANSPORT ETA engine.
- Journey planners like HYPERPATH or third party service providers, which are able to use forecast travel times, can use the real-time forecasts to improve their service quality.
- The forecasts can be translated into KPIs, especially useful for a fast comparison of different “scenario simulations”.
- The module SMART DISPLAY uses the REAL-TIME FORECASTS and known EVENTS to calculate the importance of specific events with respect to the position of the given VMS.
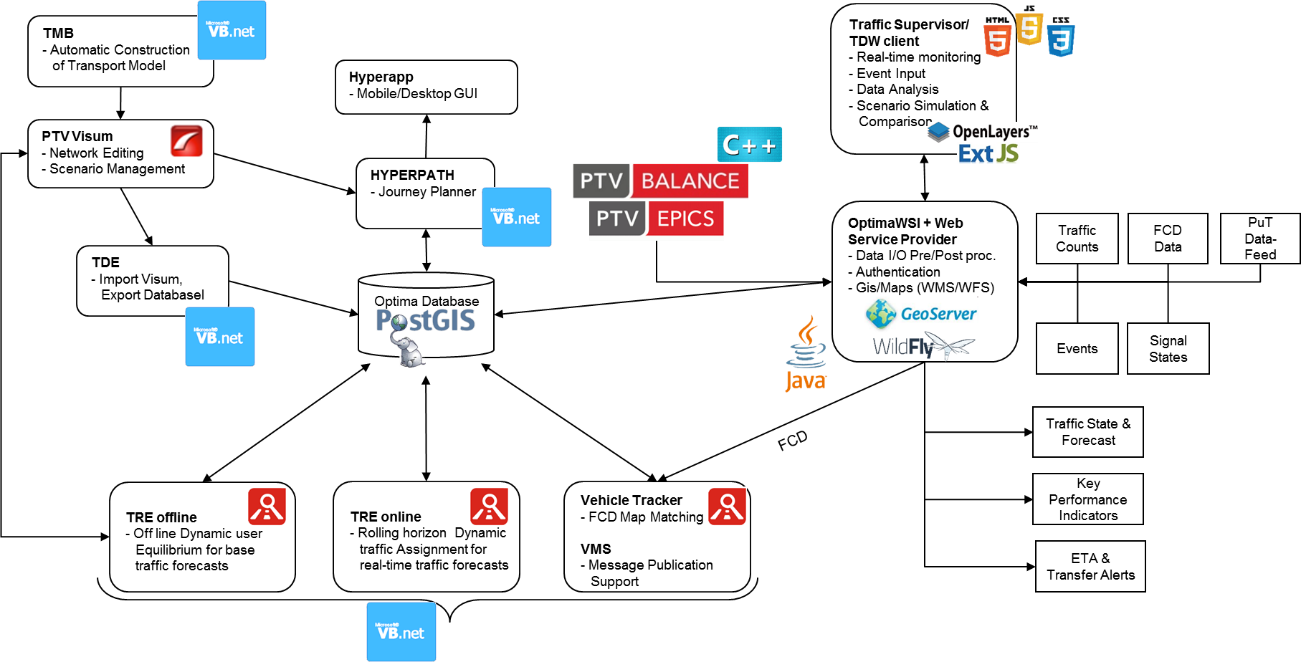
Illustration 2: the system architecture of PTV Optima, based on a radial structure with an online PostGIS geographic DB in the center, to which all software components are connected.