KPI Widgets
A widget hosts a graphical representation of a specific KPI.
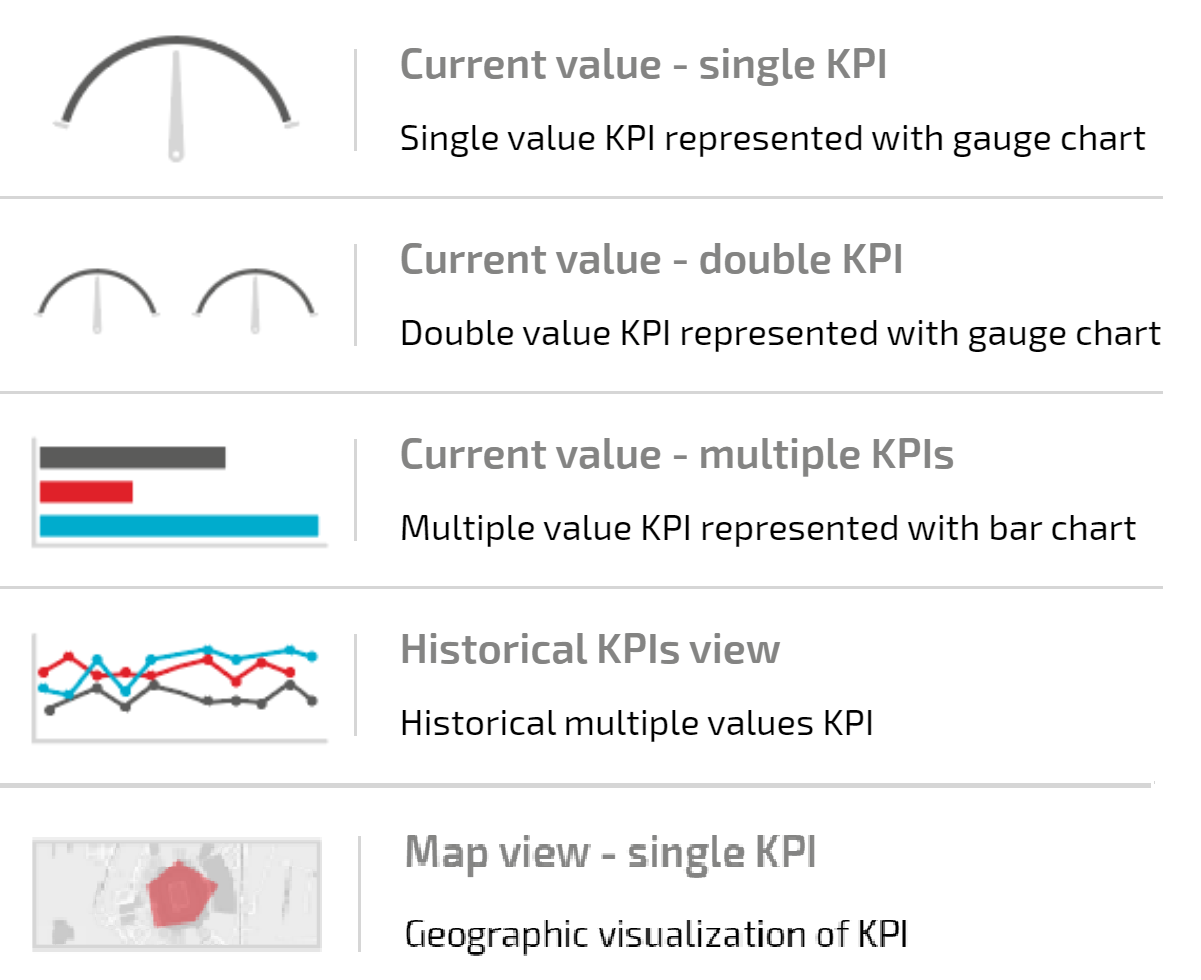
Different graphical representations can be used, depending on the KPI nature.
The association between a KPI and its graphical representation is made through the operation → KPI Dashboard workspace > Add a KPI widget.
Important: A specific KPI can be associated with different widgets. A selected widget can also host different KPIs.
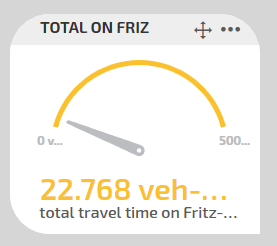
The Current value - single KPI view is suitable for a KPI which is characterized by a measurement that can be expressed in a Min - Max interval.
For example:
- The KPIs of the group → Optima Micro results
- The KPI → Adding a KPI > TOTAL TRAVEL TIME - Provider: Operational Planning
- The KPI → Adding a KPI > TOTAL TRAVEL TIME - Provider: Short-Term Forecast
... Can be associated with the following representation:
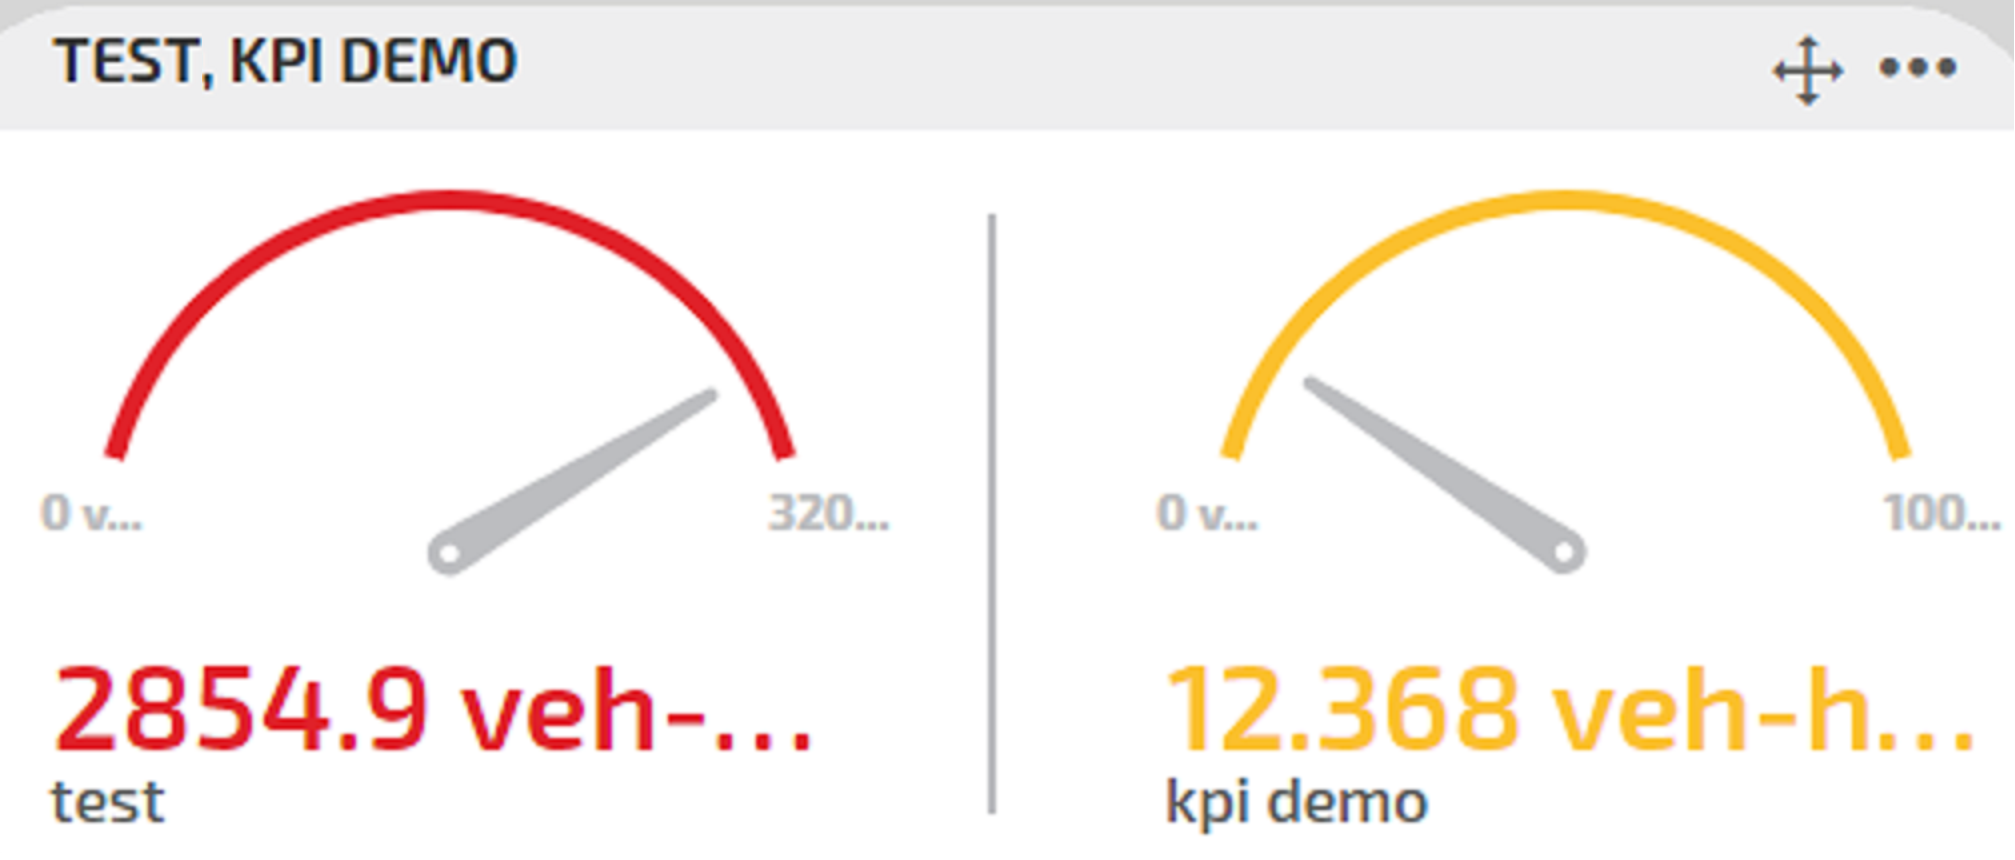
The Current value - double KPI view is similar to Current value - single KPI. You can select two different KPIs that can be coupled and tightly measured.
For example:
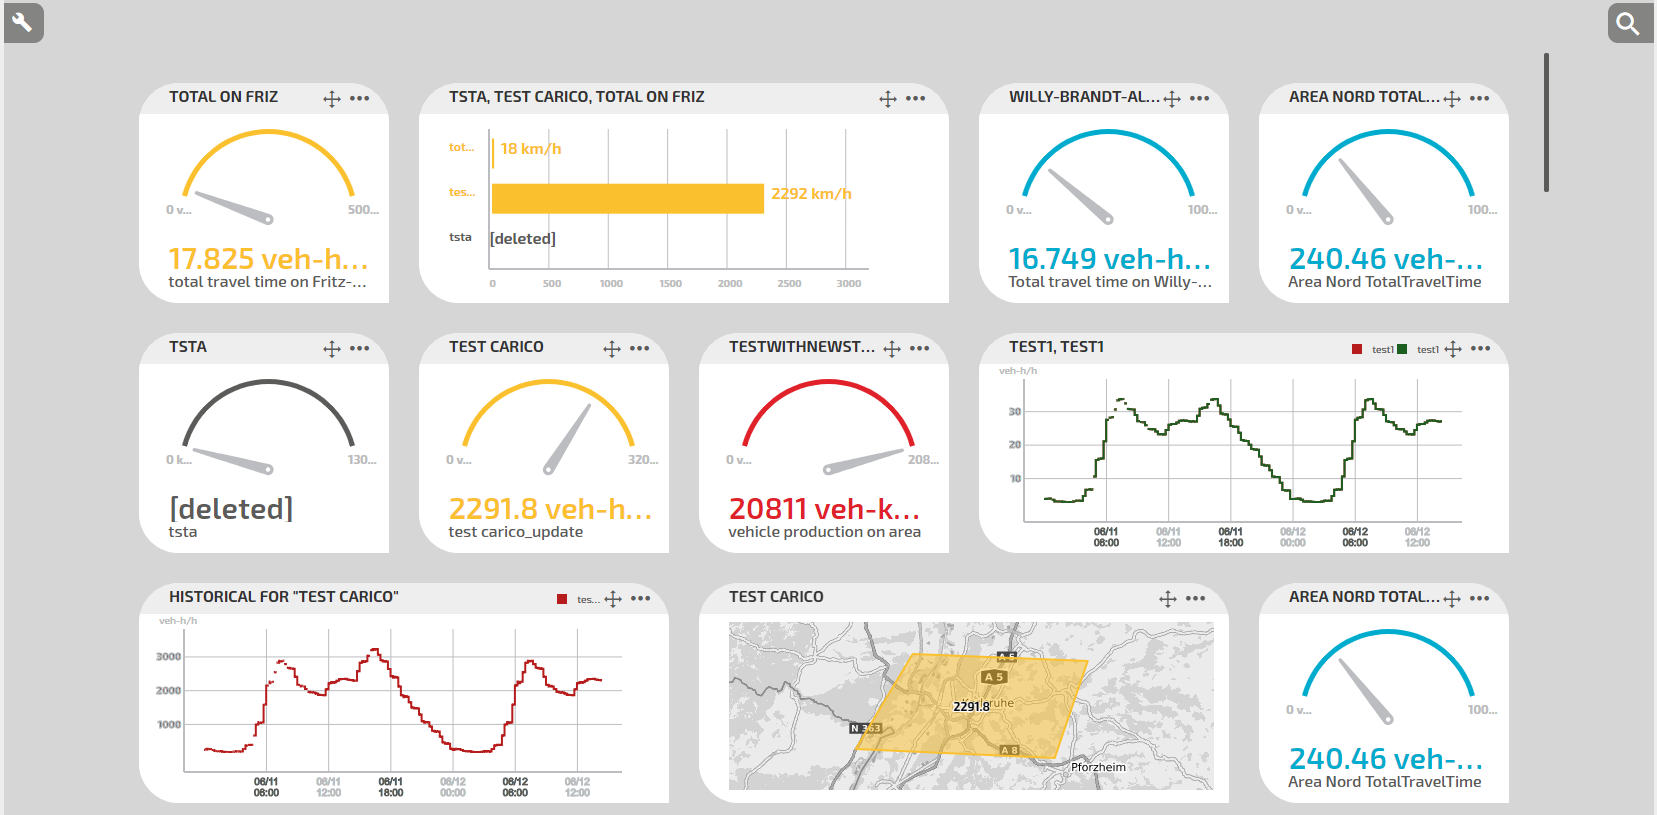
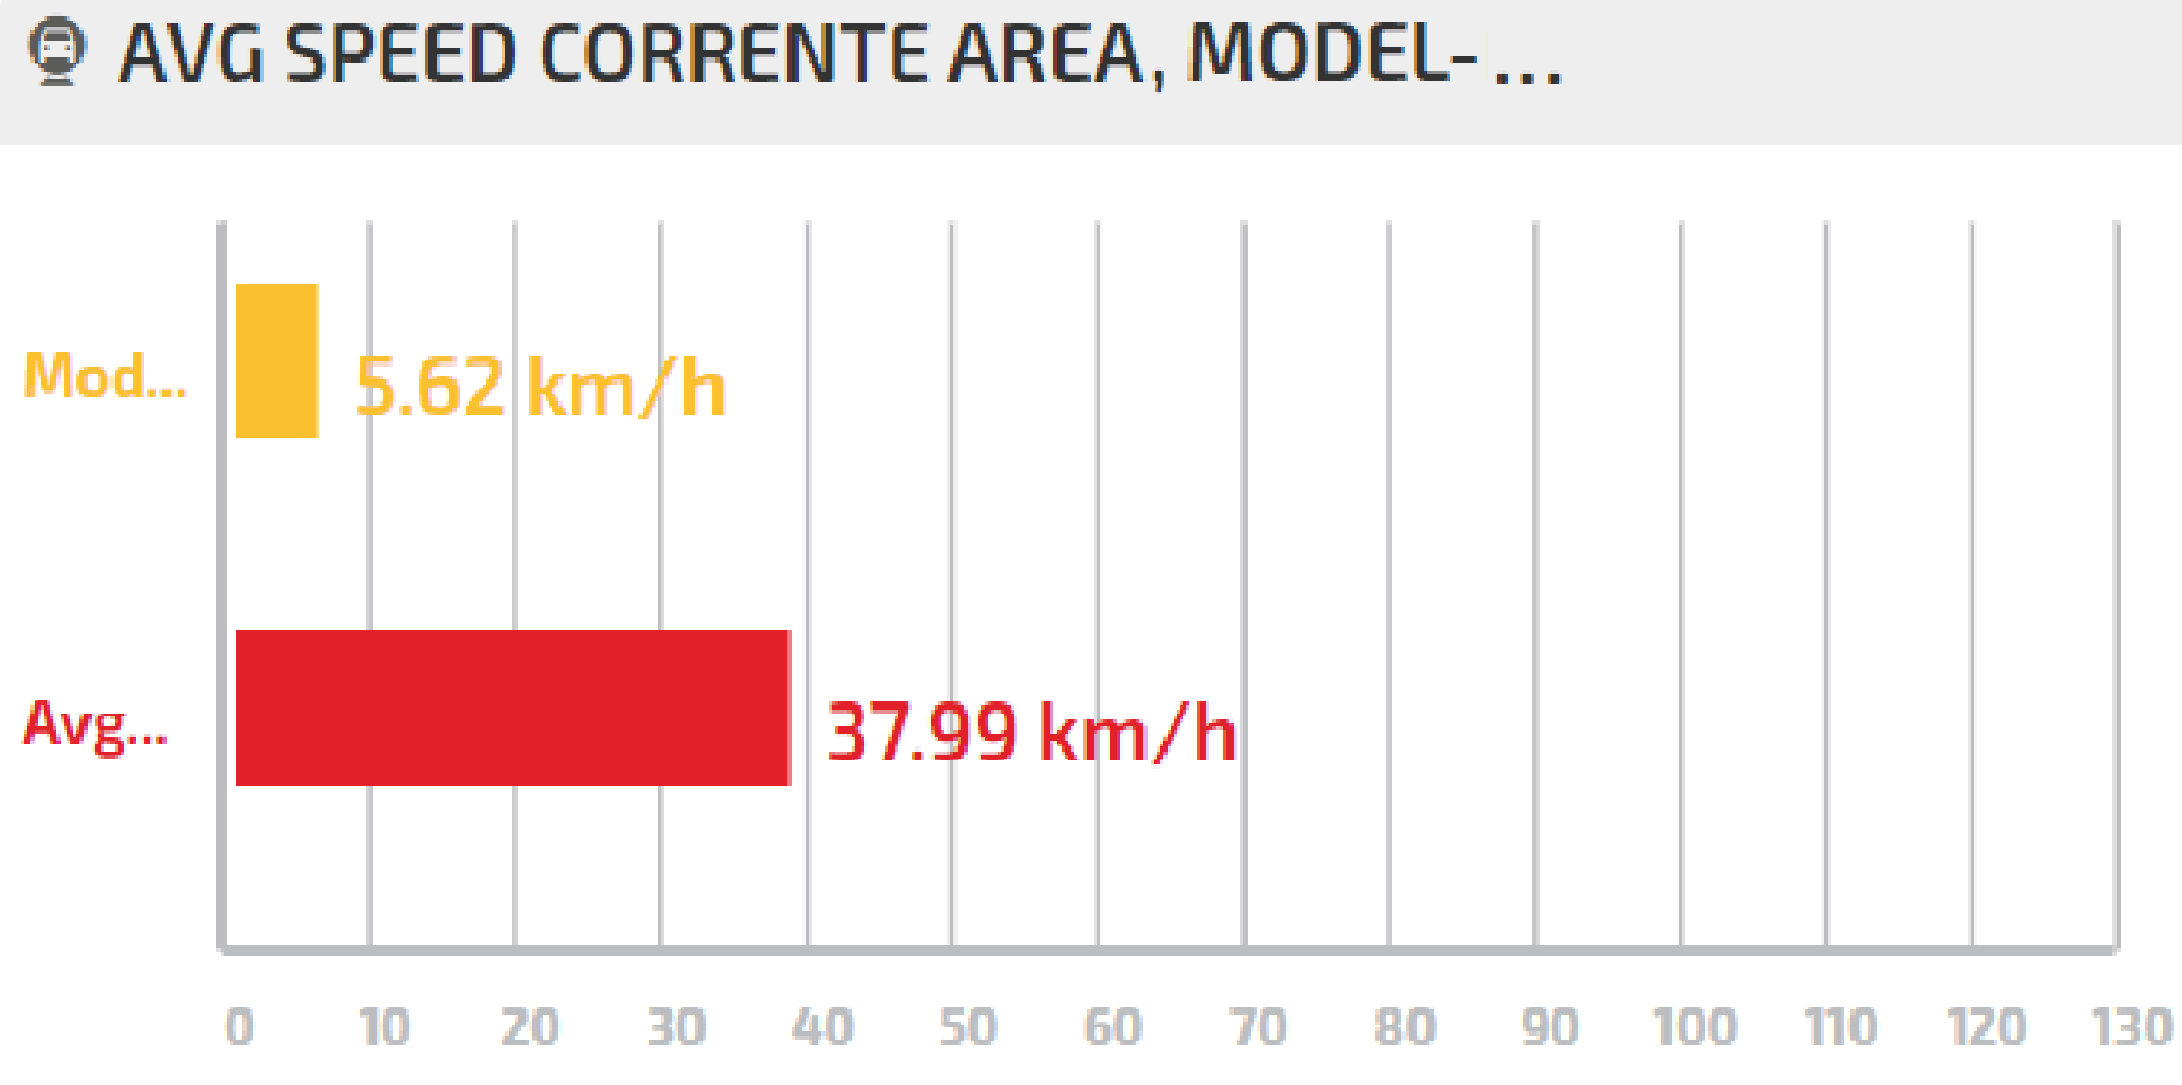
The Current value - multiple KPIs can show histograms associated with the current value of different KPIs.
For example:
The Historical KPIs view shows the collection of values registered during a period of time.
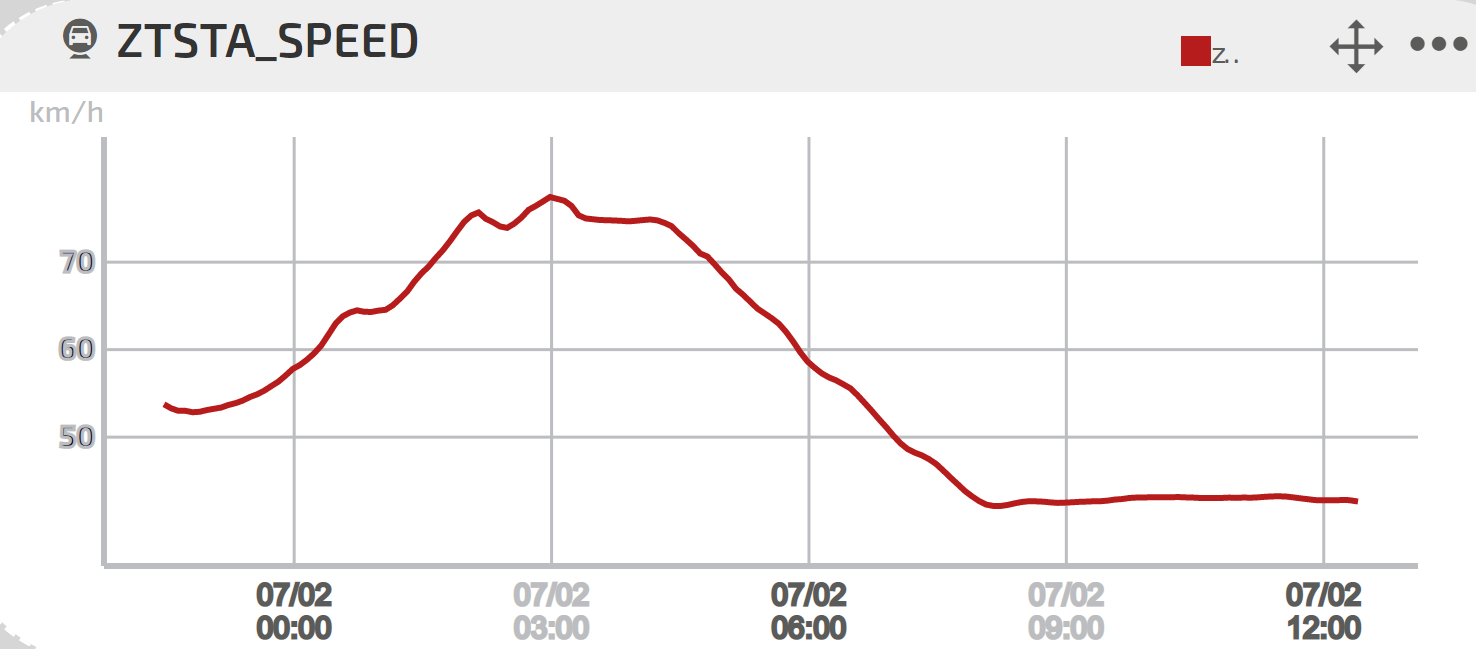
For example, if you want to monitor the → Adding a KPI > AVERAGE USER SPEED - Provider: Operational Planning, you can associate it with the Historical KPI view.
In the image below you can see the graphic of the average speeds associated with a time period of 12 hours.
You can also associate different KPIs with the widget to get a comparison of different evolutions in the same period of time:

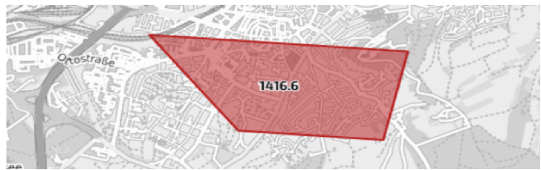
The Map view - single KPI is suitable for a KPI that describes the evolution of some parameters in a selected area.
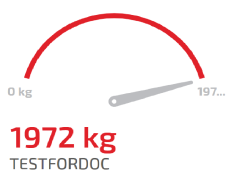
For example, in the figure below a KPI shows an intensity value produced in the selected area.
But the same KPI can be also associated with the Current value - Single KPI:
In the right-upper corner of any widget you find a "three points" icon to open a combo menu:

Here you can choose if:
-
Delete the widget
-
Edit the widget