You can access this procedure starting from:
- The Create new KPI function (ADD KPI WIDGET pop-up window).
- The ADD function (LAYER OPTIONS area of the Scenarios layer), and selecting the SCENARIO KPIS tab.
-
Click Create new KPI.
- The Edit pane opens.
- Insert the KPI name in the KPI Name text field.
- Insert the KPI description in the KPI Description text field.
-
Select one of the KPI templates available by clicking the associated accordion pane.
Tip: You can filter in the entire set of templates beforehand using the Search engine.
-
Select one of the available filters:
- ALL
-
BY ATTRIBUTE
-
Click BY ATTRIBUTE.
The List layer name pop-up window opens.
- To filter the list according to a specific column of List layer name, hover the mouse over a specific column name.
-
Click the hamburger menu.
-
Set the columns (attributes) to be included in the List layer name report (by default, all columns are active).
- Close the selection pop-up.
-
-
ON MAP
-
Click ON MAP.
-
Use the mouse to define a single polygon on the map:
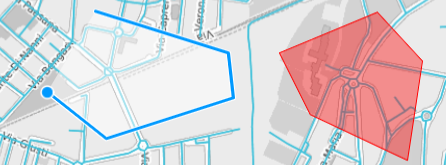
- Click Accept to update the filtering according to the area you just selected.
-
The KPI is calculated according to the filtered attributes.
Tip: You can select different filters, hence different sets of attributes: a KPI is calculated on the logic intersection (AND) of all defined sets of attributes.
- Set the attribute values shown in the Dynamic Attributes section.
-
Set the values for attributes shown into the Visualization Attributes section.
Tip: In steps 6 and 7, some attributes cannot be updated (read only).
- Click DELETE to delete the last filter you added.
- Click CANCEL to cancel the KPI.
- Click SAVE to save all the settings indicated in the previous steps.

The complete list of the available templates is determined by the Optima configuration.
The Congestion index is a percentage.
It can vary from 0 to infinity. The lower the index, the better.
Index=0 means that the network speed coincides on every street with its free flow speed.
The KPI is calculated considering the % of additional time needed for traveling through the selected streets.
Dynamic Attributes
| Dynamic KPI Attribute | Description |
|---|---|
|
Forecast distance |
Integer type. It contains the time forecast interval, which is expressed in seconds. The possible values are:
|
|
Computation type |
String type. It describes how the KPI is calculated according to a specific template. Two are the possible values:
|
|
Schedule interval |
Integer type. It contains the scheduling interval expressed in seconds. This parameter is meaningful only if: Computation type=SCHEDULED |
|
Enabled |
If the check-box is selected, the KPI instance is enabled to be computed. |
Visualization Attributes
|
KPI Attribute on TS GUI |
Description |
|---|---|
|
Improving Direction |
String type. To understand if the current KPI value is better than the previous value, it is important to state if it is increasing (the higher value is better) or decreasing (the lower value is better). Possible values:
|
|
Range |
It identifies the limits of the KPI value, which is based on two integer values: <min> and <max>.
If you set:
|
|
Quality Threshold |
Thresholds based on two real values: <min_value> and <max_value>. They must fall within the Range and are used by the GUI to show the KPI quality. The two values are used to define three regions and each region is colored according to its "quality".
<min_value> and <max_value> are set in two distinct ways:
When using the GUI, if you set:
|
|
Validity duration of the value |
Real value. It specifies (in seconds) how long a point should persist over time (the length of the segment). If this value is higher than the simulation frequency, you can see segments overlap. In the opposite case, it is possible to see a "jump" in the graphical representation. The correct value is: 1/simulation frequency. |
Total length of queues, measured in [Km].
The KPI is calculated as the total length of streets whose average speed is lower than 50% of their free flow speed.
Dynamic Attributes
| Dynamic KPI Attribute | Description |
|---|---|
|
Forecast distance |
Integer type. It contains the time forecast interval, which is expressed in seconds. The possible values are:
|
|
Computation type |
String type. It describes how the KPI is calculated according to a specific template. Two are the possible values:
|
|
Schedule interval |
Integer type. It contains the scheduling interval expressed in seconds. This parameter is meaningful only if: Computation type=SCHEDULED |
|
Enabled |
If the check-box is selected, the KPI instance is enabled to be computed. |
Visualization Attributes
|
KPI Attribute on TS GUI |
Description |
|---|---|
|
Improving Direction |
String type. To understand if the current KPI value is better than the previous value, it is important to state if it is increasing (the higher value is better) or decreasing (the lower value is better). Possible values:
|
|
Range |
It identifies the limits of the KPI value, which is based on two integer values: <min> and <max>.
If you set:
|
|
Quality Threshold |
Thresholds based on two real values: <min_value> and <max_value>. They must fall within the Range and are used by the GUI to show the KPI quality. The two values are used to define three regions and each region is colored according to its "quality".
<min_value> and <max_value> are set in two distinct ways:
When using the GUI, if you set:
|
|
Validity duration of the value |
Real value. It specifies (in seconds) how long a point should persist over time (the length of the segment). If this value is higher than the simulation frequency, you can see segments overlap. In the opposite case, it is possible to see a "jump" in the graphical representation. The correct value is: 1/simulation frequency. |
Network congestion share is a percentage.
It can vary from 0 to 100%. The lower the index, the better.
Index=0 means that the network speed coincides on every street with its free flow speed.
The KPI is calculated as the % of streets whose average speed is lower than 50% of their free flow speed.
Dynamic Attributes
| Dynamic KPI Attribute | Description |
|---|---|
|
Forecast distance |
Integer type. It contains the time forecast interval, which is expressed in seconds. The possible values are:
|
|
Computation type |
String type. It describes how the KPI is calculated according to a specific template. Two are the possible values:
|
|
Schedule interval |
Integer type. It contains the scheduling interval expressed in seconds. This parameter is meaningful only if: Computation type=SCHEDULED |
|
Enabled |
If the check-box is selected, the KPI instance is enabled to be computed. |
Visualization Attributes
|
KPI Attribute on TS GUI |
Description |
|---|---|
|
Improving Direction |
String type. To understand if the current KPI value is better than the previous value, it is important to state if it is increasing (the higher value is better) or decreasing (the lower value is better). Possible values:
|
|
Range |
It identifies the limits of the KPI value, which is based on two integer values: <min> and <max>.
If you set:
|
|
Quality Threshold |
Thresholds based on two real values: <min_value> and <max_value>. They must fall within the Range and are used by the GUI to show the KPI quality. The two values are used to define three regions and each region is colored according to its "quality".
<min_value> and <max_value> are set in two distinct ways:
When using the GUI, if you set:
|
|
Validity duration of the value |
Real value. It specifies (in seconds) how long a point should persist over time (the length of the segment). If this value is higher than the simulation frequency, you can see segments overlap. In the opposite case, it is possible to see a "jump" in the graphical representation. The correct value is: 1/simulation frequency. |
Average flow detections, measured in Veh/h.
The KPI is calculated by considering, for the selected streets, the average of the harmonized flows in the specified interval.
The harmonized values of flow considered are the values with the starting instant of validity falling within the interval.
Dynamic Attributes
| Dynamic KPI Attribute | Description |
|---|---|
|
interval |
Integer type. It contains the time interval, which is expressed in minutes and formatted as hh:mm:ss. The harmonized values (speed or flow) are the values with the starting instant of validity falling into interval. The possible values are:
Example:
"dynamicAttributes": [
    {
        "code": "interval",
        "value": "00:15:00"
    }]
|
|
Computation type |
String type. It describes how the KPI is calculated according to a specific template. Two are the possible values:
|
|
Schedule interval |
Integer type. It contains the scheduling interval expressed in seconds. This parameter is meaningful only if: Computation type=SCHEDULED |
|
Enabled |
If the check-box is selected, the KPI instance is enabled to be computed. |
Visualization Attributes
|
KPI Attribute on TS GUI |
Description |
|---|---|
|
Improving Direction |
String type. To understand if the current KPI value is better than the previous value, it is important to state if it is increasing (the higher value is better) or decreasing (the lower value is better). Possible values:
|
|
Range |
It identifies the limits of the KPI value, which is based on two integer values: <min> and <max>.
If you set:
|
|
Quality Threshold |
Thresholds based on two real values: <min_value> and <max_value>. They must fall within the Range and are used by the GUI to show the KPI quality. The two values are used to define three regions and each region is colored according to its "quality".
<min_value> and <max_value> are set in two distinct ways:
When using the GUI, if you set:
|
|
Validity duration of the value |
Real value. It specifies (in seconds) how long a point should persist over time (the length of the segment). If this value is higher than the simulation frequency, you can see segments overlap. In the opposite case, it is possible to see a "jump" in the graphical representation. The correct value is: 1/simulation frequency. |
Number of active flow detections.
The KPI is calculated by considering, for the selected streets, the number of the harmonized measurements in the specified interval.
For example, considering that the Harmonizer is run every 5 minutes, if the interval is set to 15 minutes, you can count up to 3 harmonized measurements for every street .
The harmonized values of flow considered are the values with the starting instant of validity falling within the interval.
Dynamic Attributes
| Dynamic KPI Attribute | Description |
|---|---|
|
interval |
Integer type. It contains the time interval, which is expressed in minutes and formatted as hh:mm:ss. The harmonized values (speed or flow) are the values with the starting instant of validity falling into interval. The possible values are:
Example:
"dynamicAttributes": [
    {
        "code": "interval",
        "value": "00:15:00"
    }]
|
|
Computation type |
String type. It describes how the KPI is calculated according to a specific template. Two are the possible values:
|
|
Schedule interval |
Integer type. It contains the scheduling interval expressed in seconds. This parameter is meaningful only if: Computation type=SCHEDULED |
|
Enabled |
If the check-box is selected, the KPI instance is enabled to be computed. |
Visualization Attributes
|
KPI Attribute on TS GUI |
Description |
|---|---|
|
Improving Direction |
String type. To understand if the current KPI value is better than the previous value, it is important to state if it is increasing (the higher value is better) or decreasing (the lower value is better). Possible values:
|
|
Range |
It identifies the limits of the KPI value, which is based on two integer values: <min> and <max>.
If you set:
|
|
Quality Threshold |
Thresholds based on two real values: <min_value> and <max_value>. They must fall within the Range and are used by the GUI to show the KPI quality. The two values are used to define three regions and each region is colored according to its "quality".
<min_value> and <max_value> are set in two distinct ways:
When using the GUI, if you set:
|
|
Validity duration of the value |
Real value. It specifies (in seconds) how long a point should persist over time (the length of the segment). If this value is higher than the simulation frequency, you can see segments overlap. In the opposite case, it is possible to see a "jump" in the graphical representation. The correct value is: 1/simulation frequency. |
The congestion index is a percentage.
It can vary from 0 to infinity. The lower the index, the better.
Index=0 means that the network speed coincides on every street with its free flow speed.
The KPI is calculated considering the % of additional time needed for traveling through the selected streets.
Dynamic Attributes
| Dynamic KPI Attribute | Description |
|---|---|
|
Computation type |
String type. It describes how the KPI is calculated according to a specific template. Two are the possible values:
|
|
Schedule interval |
Integer type. It contains the scheduling interval expressed in seconds. This parameter is meaningful only if: Computation type=SCHEDULED |
|
Enabled |
If the check-box is selected, the KPI instance is enabled to be computed. |
Visualization Attributes
|
KPI Attribute on TS GUI |
Description |
|---|---|
|
Improving Direction |
String type. To understand if the current KPI value is better than the previous value, it is important to state if it is increasing (the higher value is better) or decreasing (the lower value is better). Possible values:
|
|
Range |
It identifies the limits of the KPI value, which is based on two integer values: <min> and <max>.
If you set:
|
|
Quality Threshold |
Thresholds based on two real values: <min_value> and <max_value>. They must fall within the Range and are used by the GUI to show the KPI quality. The two values are used to define three regions and each region is colored according to its "quality".
<min_value> and <max_value> are set in two distinct ways:
When using the GUI, if you set:
|
|
Validity duration of the value |
Real value. It specifies (in seconds) how long a point should persist over time (the length of the segment). If this value is higher than the simulation frequency, you can see segments overlap. In the opposite case, it is possible to see a "jump" in the graphical representation. The correct value is: 1/simulation frequency. |
Total length of queues, measured in [Km].
The KPI is calculated as the total length of streets whose average speed is lower than 50% of their free flow speed.
Dynamic Attributes
| Dynamic KPI Attribute | Description |
|---|---|
|
Computation type |
String type. It describes how the KPI is calculated according to a specific template. Two are the possible values:
|
|
Schedule interval |
Integer type. It contains the scheduling interval expressed in seconds. This parameter is meaningful only if: Computation type=SCHEDULED |
|
Enabled |
If the check-box is selected, the KPI instance is enabled to be computed. |
Visualization Attributes
|
KPI Attribute on TS GUI |
Description |
|---|---|
|
Improving Direction |
String type. To understand if the current KPI value is better than the previous value, it is important to state if it is increasing (the higher value is better) or decreasing (the lower value is better). Possible values:
|
|
Range |
It identifies the limits of the KPI value, which is based on two integer values: <min> and <max>.
If you set:
|
|
Quality Threshold |
Thresholds based on two real values: <min_value> and <max_value>. They must fall within the Range and are used by the GUI to show the KPI quality. The two values are used to define three regions and each region is colored according to its "quality".
<min_value> and <max_value> are set in two distinct ways:
When using the GUI, if you set:
|
|
Validity duration of the value |
Real value. It specifies (in seconds) how long a point should persist over time (the length of the segment). If this value is higher than the simulation frequency, you can see segments overlap. In the opposite case, it is possible to see a "jump" in the graphical representation. The correct value is: 1/simulation frequency. |
The network congestion share is a percentage.
It can vary from 0 to 100%. The lower the index, the better.
Index=0 means that the network speed coincides on every street with its free flow speed.
The KPI is calculated as the % of streets whose average speed is lower than 50% of their free flow speed.
Dynamic Attributes
| Dynamic KPI Attribute | Description |
|---|---|
|
Computation type |
String type. It describes how the KPI is calculated according to a specific template. Two are the possible values:
|
|
Schedule interval |
Integer type. It contains the scheduling interval expressed in seconds. This parameter is meaningful only if: Computation type=SCHEDULED |
|
Enabled |
If the check-box is selected, the KPI instance is enabled to be computed. |
Visualization Attributes
|
KPI Attribute on TS GUI |
Description |
|---|---|
|
Improving Direction |
String type. To understand if the current KPI value is better than the previous value, it is important to state if it is increasing (the higher value is better) or decreasing (the lower value is better). Possible values:
|
|
Range |
It identifies the limits of the KPI value, which is based on two integer values: <min> and <max>.
If you set:
|
|
Quality Threshold |
Thresholds based on two real values: <min_value> and <max_value>. They must fall within the Range and are used by the GUI to show the KPI quality. The two values are used to define three regions and each region is colored according to its "quality".
<min_value> and <max_value> are set in two distinct ways:
When using the GUI, if you set:
|
|
Validity duration of the value |
Real value. It specifies (in seconds) how long a point should persist over time (the length of the segment). If this value is higher than the simulation frequency, you can see segments overlap. In the opposite case, it is possible to see a "jump" in the graphical representation. The correct value is: 1/simulation frequency. |
Average speed detections, measured in Km/h.
The KPI is calculated by considering, for the selected streets, the average of the harmonized speeds in the specified interval.
The considered harmonized values of speed are the values with the starting instant of validity falling within the interval.
Dynamic Attributes
| Dynamic KPI Attribute | Description |
|---|---|
|
interval |
Integer type. It contains the time interval, which is expressed in minutes and formatted as hh:mm:ss. The harmonized values (speed or flow) are the values with the starting instant of validity falling into interval. The possible values are:
Example:
"dynamicAttributes": [
    {
        "code": "interval",
        "value": "00:15:00"
    }]
|
|
Computation type |
String type. It describes how the KPI is calculated according to a specific template. Two are the possible values:
|
|
Schedule interval |
Integer type. It contains the scheduling interval expressed in seconds. This parameter is meaningful only if: Computation type=SCHEDULED |
|
Enabled |
If the check-box is selected, the KPI instance is enabled to be computed. |
Visualization Attributes
|
KPI Attribute on TS GUI |
Description |
|---|---|
|
Improving Direction |
String type. To understand if the current KPI value is better than the previous value, it is important to state if it is increasing (the higher value is better) or decreasing (the lower value is better). Possible values:
|
|
Range |
It identifies the limits of the KPI value, which is based on two integer values: <min> and <max>.
If you set:
|
|
Quality Threshold |
Thresholds based on two real values: <min_value> and <max_value>. They must fall within the Range and are used by the GUI to show the KPI quality. The two values are used to define three regions and each region is colored according to its "quality".
<min_value> and <max_value> are set in two distinct ways:
When using the GUI, if you set:
|
|
Validity duration of the value |
Real value. It specifies (in seconds) how long a point should persist over time (the length of the segment). If this value is higher than the simulation frequency, you can see segments overlap. In the opposite case, it is possible to see a "jump" in the graphical representation. The correct value is: 1/simulation frequency. |
Number of active speed detections.
The KPI is calculated by considering, for the selected streets, the number of the harmonized measurements in the specified interval.
For example, considering that the Harmonizer is running every 5 minutes, if the interval is set to 15 minutes, for every street you can count up to 3 harmonized measures.
The considered harmonized values of speed are the values with the starting instant of validity falling into the interval.
Dynamic Attributes
| Dynamic KPI Attribute | Description |
|---|---|
|
interval |
Integer type. It contains the time interval, which is expressed in minutes and formatted as hh:mm:ss. The harmonized values (speed or flow) are the values with the starting instant of validity falling into interval. The possible values are:
Example:
"dynamicAttributes": [
    {
        "code": "interval",
        "value": "00:15:00"
    }]
|
|
Computation type |
String type. It describes how the KPI is calculated according to a specific template. Two are the possible values:
|
|
Schedule interval |
Integer type. It contains the scheduling interval expressed in seconds. This parameter is meaningful only if: Computation type=SCHEDULED |
|
Enabled |
If the check-box is selected, the KPI instance is enabled to be computed. |
Visualization Attributes
|
KPI Attribute on TS GUI |
Description |
|---|---|
|
Improving Direction |
String type. To understand if the current KPI value is better than the previous value, it is important to state if it is increasing (the higher value is better) or decreasing (the lower value is better). Possible values:
|
|
Range |
It identifies the limits of the KPI value, which is based on two integer values: <min> and <max>.
If you set:
|
|
Quality Threshold |
Thresholds based on two real values: <min_value> and <max_value>. They must fall within the Range and are used by the GUI to show the KPI quality. The two values are used to define three regions and each region is colored according to its "quality".
<min_value> and <max_value> are set in two distinct ways:
When using the GUI, if you set:
|
|
Validity duration of the value |
Real value. It specifies (in seconds) how long a point should persist over time (the length of the segment). If this value is higher than the simulation frequency, you can see segments overlap. In the opposite case, it is possible to see a "jump" in the graphical representation. The correct value is: 1/simulation frequency. |
Network vehicle output, measured as the average flow (veh/h) which leaves the network during the interval.
The KPI is calculated as the average flow (veh/h) which leaves the network and enters any of the destination connectors during the interval.
Dynamic Attributes
| Dynamic KPI Attribute | Description |
|---|---|
|
Forecast distance |
Integer type. It contains the forecast distance, which is expressed in seconds. The possible values are:
|
|
Computation type |
String type. It describes how the KPI is calculated according to a specific template. Two are the possible values:
|
|
Schedule interval |
Integer type. It contains the scheduling interval expressed in seconds. This parameter is meaningful only if: Computation type=SCHEDULED |
|
Enabled |
If the check-box is selected, the KPI instance is enabled to be computed. |
Visualization Attributes
|
KPI Attribute on TS GUI |
Description |
|---|---|
|
Improving Direction |
String type. To understand if the current KPI value is better than the previous value, it is important to state if it is increasing (the higher value is better) or decreasing (the lower value is better). Possible values:
|
|
Range |
It identifies the limits of the KPI value, which is based on two integer values: <min> and <max>.
If you set:
|
|
Quality Threshold |
Thresholds based on two real values: <min_value> and <max_value>. They must fall within the Range and are used by the GUI to show the KPI quality. The two values are used to define three regions and each region is colored according to its "quality".
<min_value> and <max_value> are set in two distinct ways:
When using the GUI, if you set:
|
|
Validity duration of the value |
Real value. It specifies (in seconds) how long a point should persist over time (the length of the segment). If this value is higher than the simulation frequency, you can see segments overlap. In the opposite case, it is possible to see a "jump" in the graphical representation. The correct value is: 1/simulation frequency. |
Network vehicle input, measured as the average flow (veh/h) which enters the network during the interval.
The KPI is calculated as the average flow (veh/h) which enters the network and leaves any of the origin connectors during the interval.
Dynamic Attributes
| Dynamic KPI Attribute | Description |
|---|---|
|
Forecast distance |
Integer type. It contains the forecast distance, which is expressed in seconds. The possible values are:
|
|
Computation type |
String type. It describes how the KPI is calculated according to a specific template. Two are the possible values:
|
|
Schedule interval |
Integer type. It contains the scheduling interval expressed in seconds. This parameter is meaningful only if: Computation type=SCHEDULED |
|
Enabled |
If the check-box is selected, the KPI instance is enabled to be computed. |
Visualization Attributes
|
KPI Attribute on TS GUI |
Description |
|---|---|
|
Improving Direction |
String type. To understand if the current KPI value is better than the previous value, it is important to state if it is increasing (the higher value is better) or decreasing (the lower value is better). Possible values:
|
|
Range |
It identifies the limits of the KPI value, which is based on two integer values: <min> and <max>.
If you set:
|
|
Quality Threshold |
Thresholds based on two real values: <min_value> and <max_value>. They must fall within the Range and are used by the GUI to show the KPI quality. The two values are used to define three regions and each region is colored according to its "quality".
<min_value> and <max_value> are set in two distinct ways:
When using the GUI, if you set:
|
|
Validity duration of the value |
Real value. It specifies (in seconds) how long a point should persist over time (the length of the segment). If this value is higher than the simulation frequency, you can see segments overlap. In the opposite case, it is possible to see a "jump" in the graphical representation. The correct value is: 1/simulation frequency. |
Vehicle production for the selected set of links. It is computed as the entry flow on the specified links during the selected interval multiplied by the link lengths.
Dynamic Attributes
| Dynamic KPI Attribute | Description |
|---|---|
|
Forecast distance |
Integer type. It contains the forecast distance, which is expressed in seconds. The possible values are:
|
|
Computation type |
String type. It describes how the KPI is calculated according to a specific template. Two are the possible values:
|
|
Schedule interval |
Integer type. It contains the scheduling interval expressed in seconds. This parameter is meaningful only if: Computation type=SCHEDULED |
|
Enabled |
If the check-box is selected, the KPI instance is enabled to be computed. |
Visualization Attributes
|
KPI Attribute on TS GUI |
Description |
|---|---|
|
Improving Direction |
String type. To understand if the current KPI value is better than the previous value, it is important to state if it is increasing (the higher value is better) or decreasing (the lower value is better). Possible values:
|
|
Range |
It identifies the limits of the KPI value, which is based on two integer values: <min> and <max>.
If you set:
|
|
Quality Threshold |
Thresholds based on two real values: <min_value> and <max_value>. They must fall within the Range and are used by the GUI to show the KPI quality. The two values are used to define three regions and each region is colored according to its "quality".
<min_value> and <max_value> are set in two distinct ways:
When using the GUI, if you set:
|
|
Validity duration of the value |
Real value. It specifies (in seconds) how long a point should persist over time (the length of the segment). If this value is higher than the simulation frequency, you can see segments overlap. In the opposite case, it is possible to see a "jump" in the graphical representation. The correct value is: 1/simulation frequency. |
Number of vehicles in the network, measured as the simulated average number of vehicles on all the links of the network.
The KPI is calculated as the simulated average number of vehicles of all the links of the network. This equals to taking a snapshot of the network during an instant of the reference interval and to counting the number of vehicles in the snapshot. The average number derives from averaging the numbers for every instant within the interval.
Dynamic Attributes
| Dynamic KPI Attribute | Description |
|---|---|
|
onlyQueue |
String type. The possible values are:
Example:
"dynamicAttributes": [
    {
        "code": "onlyQueue",
        "value": "All vehicles"
    }]
|
|
Forecast distance |
Integer type. It contains the forecast distance, which is expressed in seconds. The possible values are:
|
|
Computation type |
String type. It describes how the KPI is calculated according to a specific template. Two are the possible values:
|
|
Schedule interval |
Integer type. It contains the scheduling interval expressed in seconds. This parameter is meaningful only if: Computation type=SCHEDULED |
|
Enabled |
If the check-box is selected, the KPI instance is enabled to be computed. |
Visualization Attributes
|
KPI Attribute on TS GUI |
Description |
|---|---|
|
Improving Direction |
String type. To understand if the current KPI value is better than the previous value, it is important to state if it is increasing (the higher value is better) or decreasing (the lower value is better). Possible values:
|
|
Range |
It identifies the limits of the KPI value, which is based on two integer values: <min> and <max>.
If you set:
|
|
Quality Threshold |
Thresholds based on two real values: <min_value> and <max_value>. They must fall within the Range and are used by the GUI to show the KPI quality. The two values are used to define three regions and each region is colored according to its "quality".
<min_value> and <max_value> are set in two distinct ways:
When using the GUI, if you set:
|
|
Validity duration of the value |
Real value. It specifies (in seconds) how long a point should persist over time (the length of the segment). If this value is higher than the simulation frequency, you can see segments overlap. In the opposite case, it is possible to see a "jump" in the graphical representation. The correct value is: 1/simulation frequency. |
Average user speed as simulated by the Short-Term Forecast (STF) engine all over the selected network.
The KPI is calculated by handling the average speed of all users as a weighted average of the simulated speeds, with weights set to the corresponding number of simulated vehicles.
If the number of simulated vehicles is missing in the network selection, the average of the model speeds is automatically set.
The KPI is calculated for the specified forecast horizon and considering only equivalent vehicles.
Dynamic Attributes
| Dynamic KPI Attribute | Description |
|---|---|
|
Forecast distance |
Integer type. It contains the forecast distance, which is expressed in seconds. The possible values are:
|
|
Computation type |
String type. It describes how the KPI is calculated according to a specific template. Two are the possible values:
|
|
Schedule interval |
Integer type. It contains the scheduling interval expressed in seconds. This parameter is meaningful only if: Computation type=SCHEDULED |
|
Enabled |
If the check-box is selected, the KPI instance is enabled to be computed. |
Visualization Attributes
|
KPI Attribute on TS GUI |
Description |
|---|---|
|
Improving Direction |
String type. To understand if the current KPI value is better than the previous value, it is important to state if it is increasing (the higher value is better) or decreasing (the lower value is better). Possible values:
|
|
Range |
It identifies the limits of the KPI value, which is based on two integer values: <min> and <max>.
If you set:
|
|
Quality Threshold |
Thresholds based on two real values: <min_value> and <max_value>. They must fall within the Range and are used by the GUI to show the KPI quality. The two values are used to define three regions and each region is colored according to its "quality".
<min_value> and <max_value> are set in two distinct ways:
When using the GUI, if you set:
|
|
Validity duration of the value |
Real value. It specifies (in seconds) how long a point should persist over time (the length of the segment). If this value is higher than the simulation frequency, you can see segments overlap. In the opposite case, it is possible to see a "jump" in the graphical representation. The correct value is: 1/simulation frequency. |
Average speed on the network as simulated by the Short-Term Forecast (STF) engine all over the selected network.
The KPI is calculated by handling the average speed of all links as a weighted average of the simulated speeds, which are computed as a ratio between the travel times spent by users to travel the links and the link lengths, with weights set to the amount of simulated flow on the links.
If the number of simulated vehicles is 0 in the network selection, the weighted average of the link speeds (freeflow, possibly modified by events) is automatically set, with weights set to the link length.
The KPI is calculated for the specified forecast horizon and considering only equivalent vehicles.
Dynamic Attributes
| Dynamic KPI Attribute | Description |
|---|---|
|
Forecast distance |
Integer type. It contains the forecast distance, which is expressed in seconds. The possible values are:
|
|
Computation type |
String type. It describes how the KPI is calculated according to a specific template. Two are the possible values:
|
|
Schedule interval |
Integer type. It contains the scheduling interval expressed in seconds. This parameter is meaningful only if: Computation type=SCHEDULED |
|
Enabled |
If the check-box is selected, the KPI instance is enabled to be computed. |
Visualization Attributes
|
KPI Attribute on TS GUI |
Description |
|---|---|
|
Improving Direction |
String type. To understand if the current KPI value is better than the previous value, it is important to state if it is increasing (the higher value is better) or decreasing (the lower value is better). Possible values:
|
|
Range |
It identifies the limits of the KPI value, which is based on two integer values: <min> and <max>.
If you set:
|
|
Quality Threshold |
Thresholds based on two real values: <min_value> and <max_value>. They must fall within the Range and are used by the GUI to show the KPI quality. The two values are used to define three regions and each region is colored according to its "quality".
<min_value> and <max_value> are set in two distinct ways:
When using the GUI, if you set:
|
|
Validity duration of the value |
Real value. It specifies (in seconds) how long a point should persist over time (the length of the segment). If this value is higher than the simulation frequency, you can see segments overlap. In the opposite case, it is possible to see a "jump" in the graphical representation. The correct value is: 1/simulation frequency. |
Total travel time, measured in hours, calculated as cumulative travel time on any set of links.
The KPI is calculated by taking, for each link, the product between:
- The number of vehicles (input flow on the link).
- The travel time spent by the vehicles.
Dynamic Attributes
| Dynamic KPI Attribute | Description |
|---|---|
|
Forecast distance |
Integer type. It contains the forecast distance, which is expressed in seconds. The possible values are:
|
|
Computation type |
String type. It describes how the KPI is calculated according to a specific template. Two are the possible values:
|
|
Schedule interval |
Integer type. It contains the scheduling interval expressed in seconds. This parameter is meaningful only if: Computation type=SCHEDULED |
|
Enabled |
If the check-box is selected, the KPI instance is enabled to be computed. |
Visualization Attributes
|
KPI Attribute on TS GUI |
Description |
|---|---|
|
Improving Direction |
String type. To understand if the current KPI value is better than the previous value, it is important to state if it is increasing (the higher value is better) or decreasing (the lower value is better). Possible values:
|
|
Range |
It identifies the limits of the KPI value, which is based on two integer values: <min> and <max>.
If you set:
|
|
Quality Threshold |
Thresholds based on two real values: <min_value> and <max_value>. They must fall within the Range and are used by the GUI to show the KPI quality. The two values are used to define three regions and each region is colored according to its "quality".
<min_value> and <max_value> are set in two distinct ways:
When using the GUI, if you set:
|
|
Validity duration of the value |
Real value. It specifies (in seconds) how long a point should persist over time (the length of the segment). If this value is higher than the simulation frequency, you can see segments overlap. In the opposite case, it is possible to see a "jump" in the graphical representation. The correct value is: 1/simulation frequency. |
Percentage of Public Transport runs with a delay.
The KPI is calculated to return a percentage number [0-100] corresponding to the total number of runs that have a delay greater than zero with respect to the total running runs.
Dynamic Attributes
| Dynamic KPI Attribute | Description |
|---|---|
|
delay |
Integer type. It contains the delay interval, expressed in seconds. The possible values are:
Example:
"dynamicAttributes": [
    {
        "code": "delay",
        "value": "120"
    }]
|
|
Computation type |
String type. It describes how the KPI is calculated according to a specific template. Two are the possible values:
|
|
Schedule interval |
Integer type. It contains the scheduling interval expressed in seconds. This parameter is meaningful only if: Computation type=SCHEDULED |
|
Enabled |
If the check-box is selected, the KPI instance is enabled to be computed. |
Visualization Attributes
|
KPI Attribute on TS GUI |
Description |
|---|---|
|
Improving Direction |
String type. To understand if the current KPI value is better than the previous value, it is important to state if it is increasing (the higher value is better) or decreasing (the lower value is better). Possible values:
|
|
Range |
It identifies the limits of the KPI value, which is based on two integer values: <min> and <max>.
If you set:
|
|
Quality Threshold |
Thresholds based on two real values: <min_value> and <max_value>. They must fall within the Range and are used by the GUI to show the KPI quality. The two values are used to define three regions and each region is colored according to its "quality".
<min_value> and <max_value> are set in two distinct ways:
When using the GUI, if you set:
|
|
Validity duration of the value |
Real value. It specifies (in seconds) how long a point should persist over time (the length of the segment). If this value is higher than the simulation frequency, you can see segments overlap. In the opposite case, it is possible to see a "jump" in the graphical representation. The correct value is: 1/simulation frequency. |
Sum of the delays, measured in minutes, of all active runs referring to the next stops.
The KPI is calculated to return the overall delay of the Public Transport system as a sum of all delays in reaching the next stops of all running runs.
Dynamic Attributes
| Dynamic KPI Attribute | Description |
|---|---|
|
Computation type |
String type. It describes how the KPI is calculated according to a specific template. Two are the possible values:
|
|
Schedule interval |
Integer type. It contains the scheduling interval expressed in seconds. This parameter is meaningful only if: Computation type=SCHEDULED |
|
Enabled |
If the check-box is selected, the KPI instance is enabled to be computed. |
Visualization Attributes
|
KPI Attribute on TS GUI |
Description |
|---|---|
|
Improving Direction |
String type. To understand if the current KPI value is better than the previous value, it is important to state if it is increasing (the higher value is better) or decreasing (the lower value is better). Possible values:
|
|
Range |
It identifies the limits of the KPI value, which is based on two integer values: <min> and <max>.
If you set:
|
|
Quality Threshold |
Thresholds based on two real values: <min_value> and <max_value>. They must fall within the Range and are used by the GUI to show the KPI quality. The two values are used to define three regions and each region is colored according to its "quality".
<min_value> and <max_value> are set in two distinct ways:
When using the GUI, if you set:
|
|
Validity duration of the value |
Real value. It specifies (in seconds) how long a point should persist over time (the length of the segment). If this value is higher than the simulation frequency, you can see segments overlap. In the opposite case, it is possible to see a "jump" in the graphical representation. The correct value is: 1/simulation frequency. |
Average delay, measured in minutes, referring to the next stops for all the active runs.
The KPI is calculated to return the average delay of the Public Transport system as an average of all delays in reaching the next stops of all running runs.
Dynamic Attributes
| Dynamic KPI Attribute | Description |
|---|---|
|
Computation type |
String type. It describes how the KPI is calculated according to a specific template. Two are the possible values:
|
|
Schedule interval |
Integer type. It contains the scheduling interval expressed in seconds. This parameter is meaningful only if: Computation type=SCHEDULED |
|
Enabled |
If the check-box is selected, the KPI instance is enabled to be computed. |
Visualization Attributes
|
KPI Attribute on TS GUI |
Description |
|---|---|
|
Improving Direction |
String type. To understand if the current KPI value is better than the previous value, it is important to state if it is increasing (the higher value is better) or decreasing (the lower value is better). Possible values:
|
|
Range |
It identifies the limits of the KPI value, which is based on two integer values: <min> and <max>.
If you set:
|
|
Quality Threshold |
Thresholds based on two real values: <min_value> and <max_value>. They must fall within the Range and are used by the GUI to show the KPI quality. The two values are used to define three regions and each region is colored according to its "quality".
<min_value> and <max_value> are set in two distinct ways:
When using the GUI, if you set:
|
|
Validity duration of the value |
Real value. It specifies (in seconds) how long a point should persist over time (the length of the segment). If this value is higher than the simulation frequency, you can see segments overlap. In the opposite case, it is possible to see a "jump" in the graphical representation. The correct value is: 1/simulation frequency. |
Maximum delay, measured in minutes, referring to the next stops for all the active runs.
The KPI is calculated to return the maximum delay of the Public Transport system as the maximum delay in reaching the next stops of all running runs.
Dynamic Attributes
| Dynamic KPI Attribute | Description |
|---|---|
|
Computation type |
String type. It describes how the KPI is calculated according to a specific template. Two are the possible values:
|
|
Schedule interval |
Integer type. It contains the scheduling interval expressed in seconds. This parameter is meaningful only if: Computation type=SCHEDULED |
|
Enabled |
If the check-box is selected, the KPI instance is enabled to be computed. |
Visualization Attributes
|
KPI Attribute on TS GUI |
Description |
|---|---|
|
Improving Direction |
String type. To understand if the current KPI value is better than the previous value, it is important to state if it is increasing (the higher value is better) or decreasing (the lower value is better). Possible values:
|
|
Range |
It identifies the limits of the KPI value, which is based on two integer values: <min> and <max>.
If you set:
|
|
Quality Threshold |
Thresholds based on two real values: <min_value> and <max_value>. They must fall within the Range and are used by the GUI to show the KPI quality. The two values are used to define three regions and each region is colored according to its "quality".
<min_value> and <max_value> are set in two distinct ways:
When using the GUI, if you set:
|
|
Validity duration of the value |
Real value. It specifies (in seconds) how long a point should persist over time (the length of the segment). If this value is higher than the simulation frequency, you can see segments overlap. In the opposite case, it is possible to see a "jump" in the graphical representation. The correct value is: 1/simulation frequency. |
Sum of the delays of all the active runs referring either to a specified stop or to all of them.
The KPI is calculated to return the aggregation of all delays for a given stop or for all active runs passing through it.
Dynamic Attributes
| Dynamic KPI Attribute | Description |
|---|---|
|
Computation type |
String type. It describes how the KPI is calculated according to a specific template. Two are the possible values:
|
|
Schedule interval |
Integer type. It contains the scheduling interval expressed in seconds. This parameter is meaningful only if: Computation type=SCHEDULED |
|
Enabled |
If the check-box is selected, the KPI instance is enabled to be computed. |
Visualization Attributes
|
KPI Attribute on TS GUI |
Description |
|---|---|
|
Improving Direction |
String type. To understand if the current KPI value is better than the previous value, it is important to state if it is increasing (the higher value is better) or decreasing (the lower value is better). Possible values:
|
|
Range |
It identifies the limits of the KPI value, which is based on two integer values: <min> and <max>.
If you set:
|
|
Quality Threshold |
Thresholds based on two real values: <min_value> and <max_value>. They must fall within the Range and are used by the GUI to show the KPI quality. The two values are used to define three regions and each region is colored according to its "quality".
<min_value> and <max_value> are set in two distinct ways:
When using the GUI, if you set:
|
|
Validity duration of the value |
Real value. It specifies (in seconds) how long a point should persist over time (the length of the segment). If this value is higher than the simulation frequency, you can see segments overlap. In the opposite case, it is possible to see a "jump" in the graphical representation. The correct value is: 1/simulation frequency. |
Average of the delays of all the active runs referring either to a specified stop or to all of them.
The KPI is calculated to return the average of all delays, for a given stop or for all active runs passing through it.
Dynamic Attributes
| Dynamic KPI Attribute | Description |
|---|---|
|
Computation type |
String type. It describes how the KPI is calculated according to a specific template. Two are the possible values:
|
|
Schedule interval |
Integer type. It contains the scheduling interval expressed in seconds. This parameter is meaningful only if: Computation type=SCHEDULED |
|
Enabled |
If the check-box is selected, the KPI instance is enabled to be computed. |
Visualization Attributes
|
KPI Attribute on TS GUI |
Description |
|---|---|
|
Improving Direction |
String type. To understand if the current KPI value is better than the previous value, it is important to state if it is increasing (the higher value is better) or decreasing (the lower value is better). Possible values:
|
|
Range |
It identifies the limits of the KPI value, which is based on two integer values: <min> and <max>.
If you set:
|
|
Quality Threshold |
Thresholds based on two real values: <min_value> and <max_value>. They must fall within the Range and are used by the GUI to show the KPI quality. The two values are used to define three regions and each region is colored according to its "quality".
<min_value> and <max_value> are set in two distinct ways:
When using the GUI, if you set:
|
|
Validity duration of the value |
Real value. It specifies (in seconds) how long a point should persist over time (the length of the segment). If this value is higher than the simulation frequency, you can see segments overlap. In the opposite case, it is possible to see a "jump" in the graphical representation. The correct value is: 1/simulation frequency. |
Maximum delay of all the active runs referring either to a specified stop or to all of them.
The KPI is calculated to return the maximum delay of all the active runs referring to specified stops.
Dynamic Attributes
| Dynamic KPI Attribute | Description |
|---|---|
|
Computation type |
String type. It describes how the KPI is calculated according to a specific template. Two are the possible values:
|
|
Schedule interval |
Integer type. It contains the scheduling interval expressed in seconds. This parameter is meaningful only if: Computation type=SCHEDULED |
|
Enabled |
If the check-box is selected, the KPI instance is enabled to be computed. |
Visualization Attributes
|
KPI Attribute on TS GUI |
Description |
|---|---|
|
Improving Direction |
String type. To understand if the current KPI value is better than the previous value, it is important to state if it is increasing (the higher value is better) or decreasing (the lower value is better). Possible values:
|
|
Range |
It identifies the limits of the KPI value, which is based on two integer values: <min> and <max>.
If you set:
|
|
Quality Threshold |
Thresholds based on two real values: <min_value> and <max_value>. They must fall within the Range and are used by the GUI to show the KPI quality. The two values are used to define three regions and each region is colored according to its "quality".
<min_value> and <max_value> are set in two distinct ways:
When using the GUI, if you set:
|
|
Validity duration of the value |
Real value. It specifies (in seconds) how long a point should persist over time (the length of the segment). If this value is higher than the simulation frequency, you can see segments overlap. In the opposite case, it is possible to see a "jump" in the graphical representation. The correct value is: 1/simulation frequency. |
Percentage of Public Transport runs with a delay.
The KPI is calculated to return a percentage number [0-100] corresponding to the total number of runs that have a delay greater than zero with respect to the total running runs.
Dynamic Attributes
| Dynamic KPI Attribute | Description |
|---|---|
|
Computation type |
String type. It describes how the KPI is calculated according to a specific template. Two are the possible values:
|
|
Schedule interval |
Integer type. It contains the scheduling interval expressed in seconds. This parameter is meaningful only if: Computation type=SCHEDULED |
|
Enabled |
If the check-box is selected, the KPI instance is enabled to be computed. |
Visualization Attributes
|
KPI Attribute on TS GUI |
Description |
|---|---|
|
Improving Direction |
String type. To understand if the current KPI value is better than the previous value, it is important to state if it is increasing (the higher value is better) or decreasing (the lower value is better). Possible values:
|
|
Range |
It identifies the limits of the KPI value, which is based on two integer values: <min> and <max>.
If you set:
|
|
Quality Threshold |
Thresholds based on two real values: <min_value> and <max_value>. They must fall within the Range and are used by the GUI to show the KPI quality. The two values are used to define three regions and each region is colored according to its "quality".
<min_value> and <max_value> are set in two distinct ways:
When using the GUI, if you set:
|
|
Validity duration of the value |
Real value. It specifies (in seconds) how long a point should persist over time (the length of the segment). If this value is higher than the simulation frequency, you can see segments overlap. In the opposite case, it is possible to see a "jump" in the graphical representation. The correct value is: 1/simulation frequency. |
Quality indicator of the Machine Learning forecast vs the measured flow.
Dynamic Attributes
| Dynamic KPI Attribute | Description |
|---|---|
|
Forecast distance |
Integer type. It contains the time forecast interval, which is expressed in seconds. The possible values are:
|
|
Computation type |
String type. It describes how the KPI is calculated according to a specific template. Two are the possible values:
|
|
Schedule interval |
Integer type. It contains the scheduling interval expressed in seconds. This parameter is meaningful only if: Computation type=SCHEDULED |
|
Enabled |
If the check-box is selected, the KPI instance is enabled to be computed. |
Visualization Attributes
|
KPI Attribute on TS GUI |
Description |
|---|---|
|
Improving Direction |
String type. To understand if the current KPI value is better than the previous value, it is important to state if it is increasing (the higher value is better) or decreasing (the lower value is better). Possible values:
|
|
Range |
It identifies the limits of the KPI value, which is based on two integer values: <min> and <max>.
If you set:
|
|
Quality Threshold |
Thresholds based on two real values: <min_value> and <max_value>. They must fall within the Range and are used by the GUI to show the KPI quality. The two values are used to define three regions and each region is colored according to its "quality".
<min_value> and <max_value> are set in two distinct ways:
When using the GUI, if you set:
|
|
Validity duration of the value |
Real value. It specifies (in seconds) how long a point should persist over time (the length of the segment). If this value is higher than the simulation frequency, you can see segments overlap. In the opposite case, it is possible to see a "jump" in the graphical representation. The correct value is: 1/simulation frequency. |
Quality indicator of the Machine Learning forecast vs the measured speed.
Dynamic Attributes
| Dynamic KPI Attribute | Description |
|---|---|
|
Forecast distance |
Integer type. It contains the time forecast interval, which is expressed in seconds. The possible values are:
|
|
Computation type |
String type. It describes how the KPI is calculated according to a specific template. Two are the possible values:
|
|
Schedule interval |
Integer type. It contains the scheduling interval expressed in seconds. This parameter is meaningful only if: Computation type=SCHEDULED |
|
Enabled |
If the check-box is selected, the KPI instance is enabled to be computed. |
Visualization Attributes
|
KPI Attribute on TS GUI |
Description |
|---|---|
|
Improving Direction |
String type. To understand if the current KPI value is better than the previous value, it is important to state if it is increasing (the higher value is better) or decreasing (the lower value is better). Possible values:
|
|
Range |
It identifies the limits of the KPI value, which is based on two integer values: <min> and <max>.
If you set:
|
|
Quality Threshold |
Thresholds based on two real values: <min_value> and <max_value>. They must fall within the Range and are used by the GUI to show the KPI quality. The two values are used to define three regions and each region is colored according to its "quality".
<min_value> and <max_value> are set in two distinct ways:
When using the GUI, if you set:
|
|
Validity duration of the value |
Real value. It specifies (in seconds) how long a point should persist over time (the length of the segment). If this value is higher than the simulation frequency, you can see segments overlap. In the opposite case, it is possible to see a "jump" in the graphical representation. The correct value is: 1/simulation frequency. |
The percentage of streets below the error threshold, measured as the relative error of the forecast speed (at the given forecast distance) versus the measured speed.
Dynamic Attributes
| Dynamic KPI Attribute | Description |
|---|---|
|
forecast-distance |
Integer type. It contains the forecast distance, which is expressed in seconds. The possible values are:
|
|
Computation type |
String type. It describes how the KPI is calculated according to a specific template. Two are the possible values:
|
|
Schedule interval |
Integer type. It contains the scheduling interval expressed in seconds. This parameter is meaningful only if: Computation type=SCHEDULED |
|
Enabled |
If the check-box is selected, the KPI instance is enabled to be computed. |
Visualization Attributes
|
KPI Attribute on TS GUI |
Description |
|---|---|
|
Improving Direction |
String type. To understand if the current KPI value is better than the previous value, it is important to state if it is increasing (the higher value is better) or decreasing (the lower value is better). Possible values:
|
|
Range |
It identifies the limits of the KPI value, which is based on two integer values: <min> and <max>.
If you set:
|
|
Quality Threshold |
Thresholds based on two real values: <min_value> and <max_value>. They must fall within the Range and are used by the GUI to show the KPI quality. The two values are used to define three regions and each region is colored according to its "quality".
<min_value> and <max_value> are set in two distinct ways:
When using the GUI, if you set:
|
|
Validity duration of the value |
Real value. It specifies (in seconds) how long a point should persist over time (the length of the segment). If this value is higher than the simulation frequency, you can see segments overlap. In the opposite case, it is possible to see a "jump" in the graphical representation. The correct value is: 1/simulation frequency. |
The percentage of streets below the error threshold, measured as the GEH of the forecast flow (at the given forecast distance) versus the measured flow.
Dynamic Attributes
| Dynamic KPI Attribute | Description |
|---|---|
|
forecast-distance |
Integer type. It contains the forecast distance, which is expressed in seconds. The possible values are:
|
|
Computation type |
String type. It describes how the KPI is calculated according to a specific template. Two are the possible values:
|
|
Schedule interval |
Integer type. It contains the scheduling interval expressed in seconds. This parameter is meaningful only if: Computation type=SCHEDULED |
|
Enabled |
If the check-box is selected, the KPI instance is enabled to be computed. |
Visualization Attributes
|
KPI Attribute on TS GUI |
Description |
|---|---|
|
Improving Direction |
String type. To understand if the current KPI value is better than the previous value, it is important to state if it is increasing (the higher value is better) or decreasing (the lower value is better). Possible values:
|
|
Range |
It identifies the limits of the KPI value, which is based on two integer values: <min> and <max>.
If you set:
|
|
Quality Threshold |
Thresholds based on two real values: <min_value> and <max_value>. They must fall within the Range and are used by the GUI to show the KPI quality. The two values are used to define three regions and each region is colored according to its "quality".
<min_value> and <max_value> are set in two distinct ways:
When using the GUI, if you set:
|
|
Validity duration of the value |
Real value. It specifies (in seconds) how long a point should persist over time (the length of the segment). If this value is higher than the simulation frequency, you can see segments overlap. In the opposite case, it is possible to see a "jump" in the graphical representation. The correct value is: 1/simulation frequency. |
Total amount of generated emissions.
Dynamic Attributes
| Dynamic KPI Attribute | Description |
|---|---|
|
externality |
String type. It contains the externality accounted for. The possible values are:
Example:
"dynamicAttributes": [
    {
        "code": "externality",
        "value": "Carbon Dioxide"
    }]
|
|
forecast |
Integer type. It contains the forecast interval, expressed in seconds. The possible values are:
Example:
"dynamicAttributes": [
    {
        "code": "fore",
        "value": "1800"
    }]
|
|
Short term forecast |
Boolean type. It contains the indication about how the KPI is handled in the Short-Term Forecast (STF) template. If:
Example:
"dynamicAttributes": [
    {
        "code": "shortTermForecastKpi",
        "value": "true"
    }]
|
|
Computation type |
String type. It describes how the KPI is calculated according to a specific template. Two are the possible values:
|
|
Schedule interval |
Integer type. It contains the scheduling interval expressed in seconds. This parameter is meaningful only if: Computation type=SCHEDULED |
|
Enabled |
If the check-box is selected, the KPI instance is enabled to be computed. |
Visualization Attributes
|
KPI Attribute on TS GUI |
Description |
|---|---|
|
Improving Direction |
String type. To understand if the current KPI value is better than the previous value, it is important to state if it is increasing (the higher value is better) or decreasing (the lower value is better). Possible values:
|
|
Range |
It identifies the limits of the KPI value, which is based on two integer values: <min> and <max>.
If you set:
|
|
Quality Threshold |
Thresholds based on two real values: <min_value> and <max_value>. They must fall within the Range and are used by the GUI to show the KPI quality. The two values are used to define three regions and each region is colored according to its "quality".
<min_value> and <max_value> are set in two distinct ways:
When using the GUI, if you set:
|
|
Validity duration of the value |
Real value. It specifies (in seconds) how long a point should persist over time (the length of the segment). If this value is higher than the simulation frequency, you can see segments overlap. In the opposite case, it is possible to see a "jump" in the graphical representation. The correct value is: 1/simulation frequency. |
Network vehicle output, measured as the average flow (veh/h) which leaves the network during the interval.
The KPI is calculated as the average flow (veh/h) which leaves the network and enters any of the destination connectors during the interval.
Dynamic Attributes
| Dynamic KPI Attribute | Description |
|---|---|
|
forecast |
Integer type. It contains the forecast interval, expressed in seconds. The possible values are:
Example:
"dynamicAttributes": [
    {
        "code": "fore",
        "value": "1800"
    }]
|
|
Short term forecast |
Boolean type. It contains the indication about how the KPI is handled in the Short-Term Forecast (STF) template. If:
Example:
"dynamicAttributes": [
    {
        "code": "shortTermForecastKpi",
        "value": "true"
    }]
|
|
Computation type |
String type. It describes how the KPI is calculated according to a specific template. Two are the possible values:
|
|
Schedule interval |
Integer type. It contains the scheduling interval expressed in seconds. This parameter is meaningful only if: Computation type=SCHEDULED |
|
Enabled |
If the check-box is selected, the KPI instance is enabled to be computed. |
Visualization Attributes
|
KPI Attribute on TS GUI |
Description |
|---|---|
|
Improving Direction |
String type. To understand if the current KPI value is better than the previous value, it is important to state if it is increasing (the higher value is better) or decreasing (the lower value is better). Possible values:
|
|
Range |
It identifies the limits of the KPI value, which is based on two integer values: <min> and <max>.
If you set:
|
|
Quality Threshold |
Thresholds based on two real values: <min_value> and <max_value>. They must fall within the Range and are used by the GUI to show the KPI quality. The two values are used to define three regions and each region is colored according to its "quality".
<min_value> and <max_value> are set in two distinct ways:
When using the GUI, if you set:
|
|
Validity duration of the value |
Real value. It specifies (in seconds) how long a point should persist over time (the length of the segment). If this value is higher than the simulation frequency, you can see segments overlap. In the opposite case, it is possible to see a "jump" in the graphical representation. The correct value is: 1/simulation frequency. |
Network vehicle input, measured as the average flow (veh/h) which enters the network during the interval.
The KPI is calculated as the average flow (veh/h) which enters the network and leaves any of the origin connectors during the interval.
Dynamic Attributes
| Dynamic KPI Attribute | Description |
|---|---|
|
forecast |
Integer type. It contains the forecast interval, expressed in seconds. The possible values are:
Example:
"dynamicAttributes": [
    {
        "code": "fore",
        "value": "1800"
    }]
|
|
Short term forecast |
Boolean type. It contains the indication about how the KPI is handled in the Short-Term Forecast (STF) template. If:
Example:
"dynamicAttributes": [
    {
        "code": "shortTermForecastKpi",
        "value": "true"
    }]
|
|
Computation type |
String type. It describes how the KPI is calculated according to a specific template. Two are the possible values:
|
|
Schedule interval |
Integer type. It contains the scheduling interval expressed in seconds. This parameter is meaningful only if: Computation type=SCHEDULED |
|
Enabled |
If the check-box is selected, the KPI instance is enabled to be computed. |
Visualization Attributes
|
KPI Attribute on TS GUI |
Description |
|---|---|
|
Improving Direction |
String type. To understand if the current KPI value is better than the previous value, it is important to state if it is increasing (the higher value is better) or decreasing (the lower value is better). Possible values:
|
|
Range |
It identifies the limits of the KPI value, which is based on two integer values: <min> and <max>.
If you set:
|
|
Quality Threshold |
Thresholds based on two real values: <min_value> and <max_value>. They must fall within the Range and are used by the GUI to show the KPI quality. The two values are used to define three regions and each region is colored according to its "quality".
<min_value> and <max_value> are set in two distinct ways:
When using the GUI, if you set:
|
|
Validity duration of the value |
Real value. It specifies (in seconds) how long a point should persist over time (the length of the segment). If this value is higher than the simulation frequency, you can see segments overlap. In the opposite case, it is possible to see a "jump" in the graphical representation. The correct value is: 1/simulation frequency. |
Vehicle production for the selected set of links. It is computed as the entry flow on the specified links during the selected interval multiplied by the link lengths.
Dynamic Attributes
| Dynamic KPI Attribute | Description |
|---|---|
|
forecast |
Integer type. It contains the forecast interval, expressed in seconds. The possible values are:
Example:
"dynamicAttributes": [
    {
        "code": "fore",
        "value": "1800"
    }]
|
|
Short term forecast |
Boolean type. It contains the indication about how the KPI is handled in the Short-Term Forecast (STF) template. If:
Example:
"dynamicAttributes": [
    {
        "code": "shortTermForecastKpi",
        "value": "true"
    }]
|
|
Computation type |
String type. It describes how the KPI is calculated according to a specific template. Two are the possible values:
|
|
Schedule interval |
Integer type. It contains the scheduling interval expressed in seconds. This parameter is meaningful only if: Computation type=SCHEDULED |
|
Enabled |
If the check-box is selected, the KPI instance is enabled to be computed. |
Visualization Attributes
|
KPI Attribute on TS GUI |
Description |
|---|---|
|
Improving Direction |
String type. To understand if the current KPI value is better than the previous value, it is important to state if it is increasing (the higher value is better) or decreasing (the lower value is better). Possible values:
|
|
Range |
It identifies the limits of the KPI value, which is based on two integer values: <min> and <max>.
If you set:
|
|
Quality Threshold |
Thresholds based on two real values: <min_value> and <max_value>. They must fall within the Range and are used by the GUI to show the KPI quality. The two values are used to define three regions and each region is colored according to its "quality".
<min_value> and <max_value> are set in two distinct ways:
When using the GUI, if you set:
|
|
Validity duration of the value |
Real value. It specifies (in seconds) how long a point should persist over time (the length of the segment). If this value is higher than the simulation frequency, you can see segments overlap. In the opposite case, it is possible to see a "jump" in the graphical representation. The correct value is: 1/simulation frequency. |
Percentage of links for which the Model Forecast Quality (Flow) is below the threshold specified in the template's attributes.
Dynamic Attributes
| Dynamic KPI Attribute | Description |
|---|---|
|
GEH flow |
Real type. It contains the threshold value for the forecast flow quality indicator. The possible values are:
For details on GEH, → Forecast Quality Indicators (FQI). |
|
forecast-distance |
Integer type. It contains the forecast distance, which is expressed in seconds. The possible values are:
|
|
Computation type |
String type. It describes how the KPI is calculated according to a specific template. Two are the possible values:
|
|
Schedule interval |
Integer type. It contains the scheduling interval expressed in seconds. This parameter is meaningful only if: Computation type=SCHEDULED |
|
Enabled |
If the check-box is selected, the KPI instance is enabled to be computed. |
Visualization Attributes
|
KPI Attribute on TS GUI |
Description |
|---|---|
|
Improving Direction |
String type. To understand if the current KPI value is better than the previous value, it is important to state if it is increasing (the higher value is better) or decreasing (the lower value is better). Possible values:
|
|
Range |
It identifies the limits of the KPI value, which is based on two integer values: <min> and <max>.
If you set:
|
|
Quality Threshold |
Thresholds based on two real values: <min_value> and <max_value>. They must fall within the Range and are used by the GUI to show the KPI quality. The two values are used to define three regions and each region is colored according to its "quality".
<min_value> and <max_value> are set in two distinct ways:
When using the GUI, if you set:
|
|
Validity duration of the value |
Real value. It specifies (in seconds) how long a point should persist over time (the length of the segment). If this value is higher than the simulation frequency, you can see segments overlap. In the opposite case, it is possible to see a "jump" in the graphical representation. The correct value is: 1/simulation frequency. |
Percentage of links for which the Model Forecast Quality (Flow) is below the threshold specified in the template's attributes.
Dynamic Attributes
| Dynamic KPI Attribute | Description |
|---|---|
|
MAPE speed |
Real type. It contains the threshold value for the forecast speed quality indicator. The possible values are:
For details on SFQI, → Forecast Quality Indicators (FQI). |
|
forecast-distance |
Integer type. It contains the forecast distance, which is expressed in seconds. The possible values are:
|
|
Computation type |
String type. It describes how the KPI is calculated according to a specific template. Two are the possible values:
|
|
Schedule interval |
Integer type. It contains the scheduling interval expressed in seconds. This parameter is meaningful only if: Computation type=SCHEDULED |
|
Enabled |
If the check-box is selected, the KPI instance is enabled to be computed. |
Visualization Attributes
|
KPI Attribute on TS GUI |
Description |
|---|---|
|
Improving Direction |
String type. To understand if the current KPI value is better than the previous value, it is important to state if it is increasing (the higher value is better) or decreasing (the lower value is better). Possible values:
|
|
Range |
It identifies the limits of the KPI value, which is based on two integer values: <min> and <max>.
If you set:
|
|
Quality Threshold |
Thresholds based on two real values: <min_value> and <max_value>. They must fall within the Range and are used by the GUI to show the KPI quality. The two values are used to define three regions and each region is colored according to its "quality".
<min_value> and <max_value> are set in two distinct ways:
When using the GUI, if you set:
|
|
Validity duration of the value |
Real value. It specifies (in seconds) how long a point should persist over time (the length of the segment). If this value is higher than the simulation frequency, you can see segments overlap. In the opposite case, it is possible to see a "jump" in the graphical representation. The correct value is: 1/simulation frequency. |
Quality indicator of the forecast flow vs. the offline model.
Dynamic Attributes
| Dynamic KPI Attribute | Description |
|---|---|
|
Short term forecast |
Boolean type. It contains the indication about how the KPI is handled in the Short-Term Forecast (STF) template. If:
Example:
"dynamicAttributes": [
    {
        "code": "shortTermForecastKpi",
        "value": "true"
    }]
|
|
Computation type |
String type. It describes how the KPI is calculated according to a specific template. Two are the possible values:
|
|
Schedule interval |
Integer type. It contains the scheduling interval expressed in seconds. This parameter is meaningful only if: Computation type=SCHEDULED |
|
Enabled |
If the check-box is selected, the KPI instance is enabled to be computed. |
Visualization Attributes
|
KPI Attribute on TS GUI |
Description |
|---|---|
|
Improving Direction |
String type. To understand if the current KPI value is better than the previous value, it is important to state if it is increasing (the higher value is better) or decreasing (the lower value is better). Possible values:
|
|
Range |
It identifies the limits of the KPI value, which is based on two integer values: <min> and <max>.
If you set:
|
|
Quality Threshold |
Thresholds based on two real values: <min_value> and <max_value>. They must fall within the Range and are used by the GUI to show the KPI quality. The two values are used to define three regions and each region is colored according to its "quality".
<min_value> and <max_value> are set in two distinct ways:
When using the GUI, if you set:
|
|
Validity duration of the value |
Real value. It specifies (in seconds) how long a point should persist over time (the length of the segment). If this value is higher than the simulation frequency, you can see segments overlap. In the opposite case, it is possible to see a "jump" in the graphical representation. The correct value is: 1/simulation frequency. |
It is an indicator of how accurate the forecast made for the current flow in the past is at varying forecast distances.
The KPI is calculated as the GEH between the harmonized traffic measurements (flow) of the flow at the current and past forecasts.
Dynamic Attributes
| Dynamic KPI Attribute | Description |
|---|---|
|
forecast |
Integer type. It contains the forecast interval, expressed in seconds. The possible values are:
Example:
"dynamicAttributes": [
    {
        "code": "fore",
        "value": "1800"
    }]
|
|
Short term forecast |
Boolean type. It contains the indication about how the KPI is handled in the Short-Term Forecast (STF) template. If:
Example:
"dynamicAttributes": [
    {
        "code": "shortTermForecastKpi",
        "value": "true"
    }]
|
|
Computation type |
String type. It describes how the KPI is calculated according to a specific template. Two are the possible values:
|
|
Schedule interval |
Integer type. It contains the scheduling interval expressed in seconds. This parameter is meaningful only if: Computation type=SCHEDULED |
|
Enabled |
If the check-box is selected, the KPI instance is enabled to be computed. |
Visualization Attributes
|
KPI Attribute on TS GUI |
Description |
|---|---|
|
Improving Direction |
String type. To understand if the current KPI value is better than the previous value, it is important to state if it is increasing (the higher value is better) or decreasing (the lower value is better). Possible values:
|
|
Range |
It identifies the limits of the KPI value, which is based on two integer values: <min> and <max>.
If you set:
|
|
Quality Threshold |
Thresholds based on two real values: <min_value> and <max_value>. They must fall within the Range and are used by the GUI to show the KPI quality. The two values are used to define three regions and each region is colored according to its "quality".
<min_value> and <max_value> are set in two distinct ways:
When using the GUI, if you set:
|
|
Validity duration of the value |
Real value. It specifies (in seconds) how long a point should persist over time (the length of the segment). If this value is higher than the simulation frequency, you can see segments overlap. In the opposite case, it is possible to see a "jump" in the graphical representation. The correct value is: 1/simulation frequency. |
It is an indicator of how close the measurement of the current flow is to the average estimate made for the current day-type.
The KPI is calculated as the GEH between the harmonized traffic measurements (flow) of the current flow and the estimate for the offline simulation of the current day-type.
Dynamic Attributes
| Dynamic KPI Attribute | Description |
|---|---|
|
Short term forecast |
Boolean type. It contains the indication about how the KPI is handled in the Short-Term Forecast (STF) template. If:
Example:
"dynamicAttributes": [
    {
        "code": "shortTermForecastKpi",
        "value": "true"
    }]
|
|
Computation type |
String type. It describes how the KPI is calculated according to a specific template. Two are the possible values:
|
|
Schedule interval |
Integer type. It contains the scheduling interval expressed in seconds. This parameter is meaningful only if: Computation type=SCHEDULED |
|
Enabled |
If the check-box is selected, the KPI instance is enabled to be computed. |
Visualization Attributes
|
KPI Attribute on TS GUI |
Description |
|---|---|
|
Improving Direction |
String type. To understand if the current KPI value is better than the previous value, it is important to state if it is increasing (the higher value is better) or decreasing (the lower value is better). Possible values:
|
|
Range |
It identifies the limits of the KPI value, which is based on two integer values: <min> and <max>.
If you set:
|
|
Quality Threshold |
Thresholds based on two real values: <min_value> and <max_value>. They must fall within the Range and are used by the GUI to show the KPI quality. The two values are used to define three regions and each region is colored according to its "quality".
<min_value> and <max_value> are set in two distinct ways:
When using the GUI, if you set:
|
|
Validity duration of the value |
Real value. It specifies (in seconds) how long a point should persist over time (the length of the segment). If this value is higher than the simulation frequency, you can see segments overlap. In the opposite case, it is possible to see a "jump" in the graphical representation. The correct value is: 1/simulation frequency. |
Quality indicator of the model forecast vs the measured speed.
Dynamic Attributes
| Dynamic KPI Attribute | Description |
|---|---|
|
forecast |
Integer type. It contains the forecast interval, expressed in seconds. The possible values are:
Example:
"dynamicAttributes": [
    {
        "code": "fore",
        "value": "1800"
    }]
|
|
Short term forecast |
Boolean type. It contains the indication about how the KPI is handled in the Short-Term Forecast (STF) template. If:
Example:
"dynamicAttributes": [
    {
        "code": "shortTermForecastKpi",
        "value": "true"
    }]
|
|
Computation type |
String type. It describes how the KPI is calculated according to a specific template. Two are the possible values:
|
|
Schedule interval |
Integer type. It contains the scheduling interval expressed in seconds. This parameter is meaningful only if: Computation type=SCHEDULED |
|
Enabled |
If the check-box is selected, the KPI instance is enabled to be computed. |
Visualization Attributes
|
KPI Attribute on TS GUI |
Description |
|---|---|
|
Improving Direction |
String type. To understand if the current KPI value is better than the previous value, it is important to state if it is increasing (the higher value is better) or decreasing (the lower value is better). Possible values:
|
|
Range |
It identifies the limits of the KPI value, which is based on two integer values: <min> and <max>.
If you set:
|
|
Quality Threshold |
Thresholds based on two real values: <min_value> and <max_value>. They must fall within the Range and are used by the GUI to show the KPI quality. The two values are used to define three regions and each region is colored according to its "quality".
<min_value> and <max_value> are set in two distinct ways:
When using the GUI, if you set:
|
|
Validity duration of the value |
Real value. It specifies (in seconds) how long a point should persist over time (the length of the segment). If this value is higher than the simulation frequency, you can see segments overlap. In the opposite case, it is possible to see a "jump" in the graphical representation. The correct value is: 1/simulation frequency. |
Number of vehicles on the network.
Dynamic Attributes
| Dynamic KPI Attribute | Description |
|---|---|
|
forecast |
Integer type. It contains the forecast interval, expressed in seconds. The possible values are:
Example:
"dynamicAttributes": [
    {
        "code": "fore",
        "value": "1800"
    }]
|
|
onlyQueue |
String type. The possible values are:
Example:
"dynamicAttributes": [
    {
        "code": "onlyQueue",
        "value": "All vehicles"
    }]
|
|
Short term forecast |
Boolean type. It contains the indication about how the KPI is handled in the Short-Term Forecast (STF) template. If:
Example:
"dynamicAttributes": [
    {
        "code": "shortTermForecastKpi",
        "value": "true"
    }]
|
|
Computation type |
String type. It describes how the KPI is calculated according to a specific template. Two are the possible values:
|
|
Schedule interval |
Integer type. It contains the scheduling interval expressed in seconds. This parameter is meaningful only if: Computation type=SCHEDULED |
|
Enabled |
If the check-box is selected, the KPI instance is enabled to be computed. |
Visualization Attributes
|
KPI Attribute on TS GUI |
Description |
|---|---|
|
Improving Direction |
String type. To understand if the current KPI value is better than the previous value, it is important to state if it is increasing (the higher value is better) or decreasing (the lower value is better). Possible values:
|
|
Range |
It identifies the limits of the KPI value, which is based on two integer values: <min> and <max>.
If you set:
|
|
Quality Threshold |
Thresholds based on two real values: <min_value> and <max_value>. They must fall within the Range and are used by the GUI to show the KPI quality. The two values are used to define three regions and each region is colored according to its "quality".
<min_value> and <max_value> are set in two distinct ways:
When using the GUI, if you set:
|
|
Validity duration of the value |
Real value. It specifies (in seconds) how long a point should persist over time (the length of the segment). If this value is higher than the simulation frequency, you can see segments overlap. In the opposite case, it is possible to see a "jump" in the graphical representation. The correct value is: 1/simulation frequency. |
Average user speed as simulated by the Short-Term Forecast (STF) engine all over the selected network.
The KPI is calculated by handling the average speed of all users as a weighted average of the simulated speeds, with weights set to the corresponding number of simulated vehicles.
If the number of simulated vehicles is missing in the network selection, the average of the model speeds is automatically set.
The KPI is calculated for the specified forecast horizon and considering only equivalent vehicles.
Dynamic Attributes
| Dynamic KPI Attribute | Description |
|---|---|
|
forecast |
Integer type. It contains the forecast interval, expressed in seconds. The possible values are:
Example:
"dynamicAttributes": [
    {
        "code": "fore",
        "value": "1800"
    }]
|
|
Short term forecast |
Boolean type. It contains the indication about how the KPI is handled in the Short-Term Forecast (STF) template. If:
Example:
"dynamicAttributes": [
    {
        "code": "shortTermForecastKpi",
        "value": "true"
    }]
|
|
Computation type |
String type. It describes how the KPI is calculated according to a specific template. Two are the possible values:
|
|
Schedule interval |
Integer type. It contains the scheduling interval expressed in seconds. This parameter is meaningful only if: Computation type=SCHEDULED |
|
Enabled |
If the check-box is selected, the KPI instance is enabled to be computed. |
Visualization Attributes
|
KPI Attribute on TS GUI |
Description |
|---|---|
|
Improving Direction |
String type. To understand if the current KPI value is better than the previous value, it is important to state if it is increasing (the higher value is better) or decreasing (the lower value is better). Possible values:
|
|
Range |
It identifies the limits of the KPI value, which is based on two integer values: <min> and <max>.
If you set:
|
|
Quality Threshold |
Thresholds based on two real values: <min_value> and <max_value>. They must fall within the Range and are used by the GUI to show the KPI quality. The two values are used to define three regions and each region is colored according to its "quality".
<min_value> and <max_value> are set in two distinct ways:
When using the GUI, if you set:
|
|
Validity duration of the value |
Real value. It specifies (in seconds) how long a point should persist over time (the length of the segment). If this value is higher than the simulation frequency, you can see segments overlap. In the opposite case, it is possible to see a "jump" in the graphical representation. The correct value is: 1/simulation frequency. |
Average speed on the network as simulated by the Short-Term Forecast (STF) engine all over the selected network.
The KPI is calculated by handling the average speed of all links as a weighted average of the simulated speeds, which are computed as a ratio between the travel times spent by users to travel the links and the link lengths, with weights set to the amount of simulated flow on the links.
If the number of simulated vehicles is 0 in the network selection, the weighted average of the link speeds (freeflow, possibly modified by events) is automatically set, with weights set to the link length.
The KPI is calculated for the specified forecast horizon and considering only equivalent vehicles.
Dynamic Attributes
| Dynamic KPI Attribute | Description |
|---|---|
|
forecast |
Integer type. It contains the forecast interval, expressed in seconds. The possible values are:
Example:
"dynamicAttributes": [
    {
        "code": "fore",
        "value": "1800"
    }]
|
|
Short term forecast |
Boolean type. It contains the indication about how the KPI is handled in the Short-Term Forecast (STF) template. If:
Example:
"dynamicAttributes": [
    {
        "code": "shortTermForecastKpi",
        "value": "true"
    }]
|
|
Computation type |
String type. It describes how the KPI is calculated according to a specific template. Two are the possible values:
|
|
Schedule interval |
Integer type. It contains the scheduling interval expressed in seconds. This parameter is meaningful only if: Computation type=SCHEDULED |
|
Enabled |
If the check-box is selected, the KPI instance is enabled to be computed. |
Visualization Attributes
|
KPI Attribute on TS GUI |
Description |
|---|---|
|
Improving Direction |
String type. To understand if the current KPI value is better than the previous value, it is important to state if it is increasing (the higher value is better) or decreasing (the lower value is better). Possible values:
|
|
Range |
It identifies the limits of the KPI value, which is based on two integer values: <min> and <max>.
If you set:
|
|
Quality Threshold |
Thresholds based on two real values: <min_value> and <max_value>. They must fall within the Range and are used by the GUI to show the KPI quality. The two values are used to define three regions and each region is colored according to its "quality".
<min_value> and <max_value> are set in two distinct ways:
When using the GUI, if you set:
|
|
Validity duration of the value |
Real value. It specifies (in seconds) how long a point should persist over time (the length of the segment). If this value is higher than the simulation frequency, you can see segments overlap. In the opposite case, it is possible to see a "jump" in the graphical representation. The correct value is: 1/simulation frequency. |
Total travel time, measured in hours, calculated as cumulative travel time on any set of links.
The KPI is calculated by taking, for each link, the product between:
- The number of vehicles (input flow on the link).
- The travel time spent by the vehicles.
Dynamic Attributes
| Dynamic KPI Attribute | Description |
|---|---|
|
forecast |
Integer type. It contains the forecast interval, expressed in seconds. The possible values are:
Example:
"dynamicAttributes": [
    {
        "code": "fore",
        "value": "1800"
    }]
|
|
Short term forecast |
Boolean type. It contains the indication about how the KPI is handled in the Short-Term Forecast (STF) template. If:
Example:
"dynamicAttributes": [
    {
        "code": "shortTermForecastKpi",
        "value": "true"
    }]
|
|
Computation type |
String type. It describes how the KPI is calculated according to a specific template. Two are the possible values:
|
|
Schedule interval |
Integer type. It contains the scheduling interval expressed in seconds. This parameter is meaningful only if: Computation type=SCHEDULED |
|
Enabled |
If the check-box is selected, the KPI instance is enabled to be computed. |
Visualization Attributes
|
KPI Attribute on TS GUI |
Description |
|---|---|
|
Improving Direction |
String type. To understand if the current KPI value is better than the previous value, it is important to state if it is increasing (the higher value is better) or decreasing (the lower value is better). Possible values:
|
|
Range |
It identifies the limits of the KPI value, which is based on two integer values: <min> and <max>.
If you set:
|
|
Quality Threshold |
Thresholds based on two real values: <min_value> and <max_value>. They must fall within the Range and are used by the GUI to show the KPI quality. The two values are used to define three regions and each region is colored according to its "quality".
<min_value> and <max_value> are set in two distinct ways:
When using the GUI, if you set:
|
|
Validity duration of the value |
Real value. It specifies (in seconds) how long a point should persist over time (the length of the segment). If this value is higher than the simulation frequency, you can see segments overlap. In the opposite case, it is possible to see a "jump" in the graphical representation. The correct value is: 1/simulation frequency. |
Travel time, measured in minutes, associated with a path or area.
The KPI is calculated along a path or summed up from all the links of an area according to Optima Micro results.
It is only applicable within an Optima Micro subnetwork.
Dynamic Attributes
| Dynamic KPI Attribute | Description |
|---|---|
|
Micro forecast horizon |
Integer type. It contains the forecast interval, expressed in minutes. The possible values are:
|
|
Computation type |
String type. It describes how the KPI is calculated according to a specific template. Two are the possible values:
|
|
Schedule interval |
Integer type. It contains the scheduling interval expressed in seconds. This parameter is meaningful only if: Computation type=SCHEDULED |
|
Enabled |
If the check-box is selected, the KPI instance is enabled to be computed. |
Visualization Attributes
|
KPI Attribute on TS GUI |
Description |
|---|---|
|
Improving Direction |
String type. To understand if the current KPI value is better than the previous value, it is important to state if it is increasing (the higher value is better) or decreasing (the lower value is better). Possible values:
|
|
Range |
It identifies the limits of the KPI value, which is based on two integer values: <min> and <max>.
If you set:
|
|
Quality Threshold |
Thresholds based on two real values: <min_value> and <max_value>. They must fall within the Range and are used by the GUI to show the KPI quality. The two values are used to define three regions and each region is colored according to its "quality".
<min_value> and <max_value> are set in two distinct ways:
When using the GUI, if you set:
|
|
Validity duration of the value |
Real value. It specifies (in seconds) how long a point should persist over time (the length of the segment). If this value is higher than the simulation frequency, you can see segments overlap. In the opposite case, it is possible to see a "jump" in the graphical representation. The correct value is: 1/simulation frequency. |
Total vehicle time, measured in hours, spent on a path or area.
The KPI is calculated by considering the total time spent by all vehicles on a path or all links of an area according to Optima Micro results.
It is only applicable within an Optima Micro subnetwork.
Dynamic Attributes
| Dynamic KPI Attribute | Description |
|---|---|
|
Micro forecast horizon |
Integer type. It contains the forecast interval, expressed in minutes. The possible values are:
|
|
Computation type |
String type. It describes how the KPI is calculated according to a specific template. Two are the possible values:
|
|
Schedule interval |
Integer type. It contains the scheduling interval expressed in seconds. This parameter is meaningful only if: Computation type=SCHEDULED |
|
Enabled |
If the check-box is selected, the KPI instance is enabled to be computed. |
Visualization Attributes
|
KPI Attribute on TS GUI |
Description |
|---|---|
|
Improving Direction |
String type. To understand if the current KPI value is better than the previous value, it is important to state if it is increasing (the higher value is better) or decreasing (the lower value is better). Possible values:
|
|
Range |
It identifies the limits of the KPI value, which is based on two integer values: <min> and <max>.
If you set:
|
|
Quality Threshold |
Thresholds based on two real values: <min_value> and <max_value>. They must fall within the Range and are used by the GUI to show the KPI quality. The two values are used to define three regions and each region is colored according to its "quality".
<min_value> and <max_value> are set in two distinct ways:
When using the GUI, if you set:
|
|
Validity duration of the value |
Real value. It specifies (in seconds) how long a point should persist over time (the length of the segment). If this value is higher than the simulation frequency, you can see segments overlap. In the opposite case, it is possible to see a "jump" in the graphical representation. The correct value is: 1/simulation frequency. |
Average travel time, measured in minutes, spent by vehicles on the selected path of the network.
The KPI is calculated as the sum of the travel times of every link on the path, as estimated by PTV Optima.
If the space-time trajectory of the vehicle along the path falls in a result time interval, the used travel time is interpolated between the instantaneous travel times computed at the start and end times of the simulation intervals.
Dynamic Attributes
| Dynamic KPI Attribute | Description |
|---|---|
|
forecast |
Integer type. It contains the forecast interval, expressed in seconds. The possible values are:
Example:
"dynamicAttributes": [
    {
        "code": "fore",
        "value": "1800"
    }]
|
|
Short term forecast |
Boolean type. It contains the indication about how the KPI is handled in the Short-Term Forecast (STF) template. If:
Example:
"dynamicAttributes": [
    {
        "code": "shortTermForecastKpi",
        "value": "true"
    }]
|
|
Road Closures |
String type. Two possible values:
Default value: Calculate even on closed roads. |
|
Computation type |
String type. It describes how the KPI is calculated according to a specific template. Two are the possible values:
|
|
Schedule interval |
Integer type. It contains the scheduling interval expressed in seconds. This parameter is meaningful only if: Computation type=SCHEDULED |
|
Enabled |
If the check-box is selected, the KPI instance is enabled to be computed. |
Visualization Attributes
|
KPI Attribute on TS GUI |
Description |
|---|---|
|
Improving Direction |
String type. To understand if the current KPI value is better than the previous value, it is important to state if it is increasing (the higher value is better) or decreasing (the lower value is better). Possible values:
|
|
Range |
It identifies the limits of the KPI value, which is based on two integer values: <min> and <max>.
If you set:
|
|
Quality Threshold |
Thresholds based on two real values: <min_value> and <max_value>. They must fall within the Range and are used by the GUI to show the KPI quality. The two values are used to define three regions and each region is colored according to its "quality".
<min_value> and <max_value> are set in two distinct ways:
When using the GUI, if you set:
|
|
Validity duration of the value |
Real value. It specifies (in seconds) how long a point should persist over time (the length of the segment). If this value is higher than the simulation frequency, you can see segments overlap. In the opposite case, it is possible to see a "jump" in the graphical representation. The correct value is: 1/simulation frequency. |
Average travel time, measured in minutes, spent by vehicles on the selected path of the network.
The KPI is calculated as the sum of the travel times of every link along the path, as estimated by PTV Optima.
If the space-time trajectory of the vehicle along the path falls within a result time interval, the used travel time is interpolated between the instantaneous travel times computed at the start and end times of the simulation intervals.
Dynamic Attributes
| Dynamic KPI Attribute | Description |
|---|---|
|
Forecast distance |
Integer type. It contains the forecast distance, which is expressed in seconds. The possible values are:
|
|
Road Closures |
String type. Two possible values:
Default value: Calculate even on closed roads. |
|
Computation type |
String type. It describes how the KPI is calculated according to a specific template. Two are the possible values:
|
|
Schedule interval |
Integer type. It contains the scheduling interval expressed in seconds. This parameter is meaningful only if: Computation type=SCHEDULED |
|
Enabled |
If the check-box is selected, the KPI instance is enabled to be computed. |
Visualization Attributes
|
KPI Attribute on TS GUI |
Description |
|---|---|
|
Improving Direction |
String type. To understand if the current KPI value is better than the previous value, it is important to state if it is increasing (the higher value is better) or decreasing (the lower value is better). Possible values:
|
|
Range |
It identifies the limits of the KPI value, which is based on two integer values: <min> and <max>.
If you set:
|
|
Quality Threshold |
Thresholds based on two real values: <min_value> and <max_value>. They must fall within the Range and are used by the GUI to show the KPI quality. The two values are used to define three regions and each region is colored according to its "quality".
<min_value> and <max_value> are set in two distinct ways:
When using the GUI, if you set:
|
|
Validity duration of the value |
Real value. It specifies (in seconds) how long a point should persist over time (the length of the segment). If this value is higher than the simulation frequency, you can see segments overlap. In the opposite case, it is possible to see a "jump" in the graphical representation. The correct value is: 1/simulation frequency. |
Amount of total emissions over the selected network, calculated every hour (g/km/h). The KPI is calculated through the sum of a selected pollutant over a time interval and the length of every affected street.
The pollutant type can be selected from the list:
-
Particulate matter (10μm)
-
Particulate matter (2.5μm)
-
Nitrogen dioxide (no2)
-
Ozone (o3)
-
Sulfur dioxide (so2)
-
Carbon monoxide (co)
Dynamic Attributes
| Dynamic KPI Attribute | Description |
|---|---|
|
forecast |
Integer type. It contains the forecast interval, expressed in seconds. The possible values are:
Example:
"dynamicAttributes": [
    {
        "code": "fore",
        "value": "1800"
    }]
|
|
Computation type |
String type. It describes how the KPI is calculated according to a specific template. Two are the possible values:
|
|
Schedule interval |
Integer type. It contains the scheduling interval expressed in seconds. This parameter is meaningful only if: Computation type=SCHEDULED |
|
Enabled |
If the check-box is selected, the KPI instance is enabled to be computed. |
|
Total Emissions Externality |
The pollutant type can be selected from the list:
|
Visualization Attributes
|
KPI Attribute on TS GUI |
Description |
|---|---|
|
Improving Direction |
String type. To understand if the current KPI value is better than the previous value, it is important to state if it is increasing (the higher value is better) or decreasing (the lower value is better). Possible values:
|
|
Range |
It identifies the limits of the KPI value, which is based on two integer values: <min> and <max>.
If you set:
|
|
Quality Threshold |
Thresholds based on two real values: <min_value> and <max_value>. They must fall within the Range and are used by the GUI to show the KPI quality. The two values are used to define three regions and each region is colored according to its "quality".
<min_value> and <max_value> are set in two distinct ways:
When using the GUI, if you set:
|
|
Validity duration of the value |
Real value. It specifies (in seconds) how long a point should persist over time (the length of the segment). If this value is higher than the simulation frequency, you can see segments overlap. In the opposite case, it is possible to see a "jump" in the graphical representation. The correct value is: 1/simulation frequency. |
Amount of total emissions over the selected network (g). The KPI is calculated through the sum of a selected pollutant over the affected links and the time of the Optima Micro simulation.
The pollutant type can be selected from the list:
-
Carbone dioxide (co2)
-
Carbon monoxide (co)
-
Nitrogen monoxide (nox)
-
Particulates
-
Fuel consumption
Dynamic Attributes
| Dynamic KPI Attribute | Description |
|---|---|
|
forecast |
Integer type. It contains the forecast interval, expressed in seconds. The possible values are:
Example:
"dynamicAttributes": [
    {
        "code": "fore",
        "value": "1800"
    }]
|
|
Road Closures |
String type. Two possible values:
Default value: Calculate even on closed roads. |
|
Computation type |
String type. It describes how the KPI is calculated according to a specific template. Two are the possible values:
|
|
Schedule interval |
Integer type. It contains the scheduling interval expressed in seconds. This parameter is meaningful only if: Computation type=SCHEDULED |
|
Enabled |
If the check-box is selected, the KPI instance is enabled to be computed. |
|
Vissim Emissions Externality |
The pollutant type can be selected from the list:
|
Visualization Attributes
|
KPI Attribute on TS GUI |
Description |
|---|---|
|
Improving Direction |
String type. To understand if the current KPI value is better than the previous value, it is important to state if it is increasing (the higher value is better) or decreasing (the lower value is better). Possible values:
|
|
Range |
It identifies the limits of the KPI value, which is based on two integer values: <min> and <max>.
If you set:
|
|
Quality Threshold |
Thresholds based on two real values: <min_value> and <max_value>. They must fall within the Range and are used by the GUI to show the KPI quality. The two values are used to define three regions and each region is colored according to its "quality".
<min_value> and <max_value> are set in two distinct ways:
When using the GUI, if you set:
|
|
Validity duration of the value |
Real value. It specifies (in seconds) how long a point should persist over time (the length of the segment). If this value is higher than the simulation frequency, you can see segments overlap. In the opposite case, it is possible to see a "jump" in the graphical representation. The correct value is: 1/simulation frequency. |