Quick start guide Creating a chart
The Quick start guide shows you the key steps for selecting the desired chart type and data you want to display.
Optionally, first select network object type or network objects
You can create a line chart or a bar chart in the following ways:
- With preselection of the network object type: You select the network object type on the network object sidebar and click Create chart on the shortcut menu. This transfers the network object type to the configuration of the chart in the Create Chart window. In this window, you configure the chart and the display (Creating charts from a network object type).
- With preselection of one or more network objects in a list: You select network objects in an attribute list and click Create Chart on the shortcut menu. This transfers the network objects to the configuration of the chart in the Create Chart window. In this window, you configure the chart and the display (Creating charts from a network object type).
- With preselection of one or more network objects in the network editor: You select network objects in the network editor and click Create Chart on the shortcut menu. This transfers the network objects to the configuration of the chart in the Create Chart window. In this window, you configure the chart and the display (Creating charts from a network object type).
- Without preselection: To create a line chart or bar chart, open the Create Chart window and select the network object type, network objects and attributes in it. Then you configure the chart and the display (Creating line charts or bar charts without preselection).
To create a scatter plot, open the Create scatter plot window(Creating a scatter plot). Preselection of a network object type on the network object sidebar or of network objects in an attribute list is not possible for scatter plots.
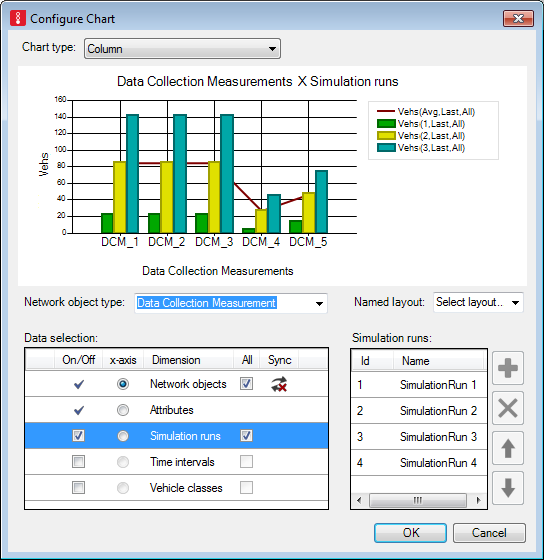
Configuring a bar chart or line chart
In the Create Chart window, select more data so that the chart can be created.
![]()
1. Select the desired entry in the Chart type list box.
2. Make sure that the desired entry has been selected in the Network object type list box.
3. If you want to add objects in the Network objects dimension for the selected network object type in the area on the right, perform the following four steps:
4. Click the Network objects dimension.
5. Click the  button.
A selection window opens.
6. Select the desired objects.
7. Confirm with OK.
The selected objects are shown in the area on the right.
8. If you do not wish the x-axis to be labeled with the object name, in the X-axis label column, enter the name of your choice.
9. Repeat the last steps for the Attributes dimension.
The selected attributes are shown in the area on the right. A chart preview is displayed.
Next you can limit the selected objects and attributes to the desired simulation runs, time intervals, vehicle classes or pedestrian classes. You can only select these if the selected network object type, base data type or result data type has attributes related to the desired dimension.
10. Repeat the following four steps for the desired dimensions:
11. Make sure that the On/Off option is selected for the dimension in the Data selection list box.
12. Click the button.
A selection window opens.
13. Select the desired objects.
14. Confirm with OK.
15. In the Data selection list, select x-axis for the dimension, whose objects you want to plot on the x-axis.
The selected objects are shown in the area on the right. A chart preview is displayed.
16. Confirm with OK.
The chart is displayed.
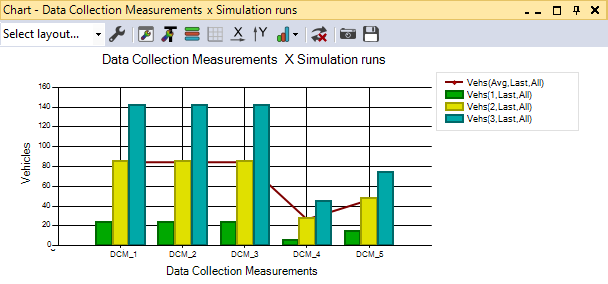
17. Edit the chart if you so wish (Configuring a created chart).
18. Reuse the chart if you so wish (Continue using a chart).
Configuring a scatter plot
In the Create scatter plot window, select all the data so that the chart can be created (Creating a scatter plot).
![]()
1. Edit the chart if you so wish (Configuring a created chart).
2. Reuse the chart if you so wish (Continue using a chart).
