Creating line charts or bar charts without preselection
You first select the chart type and then all the data for the chart itself.
|
|
Tips:
|
1. On the View menu, click Create Chart.
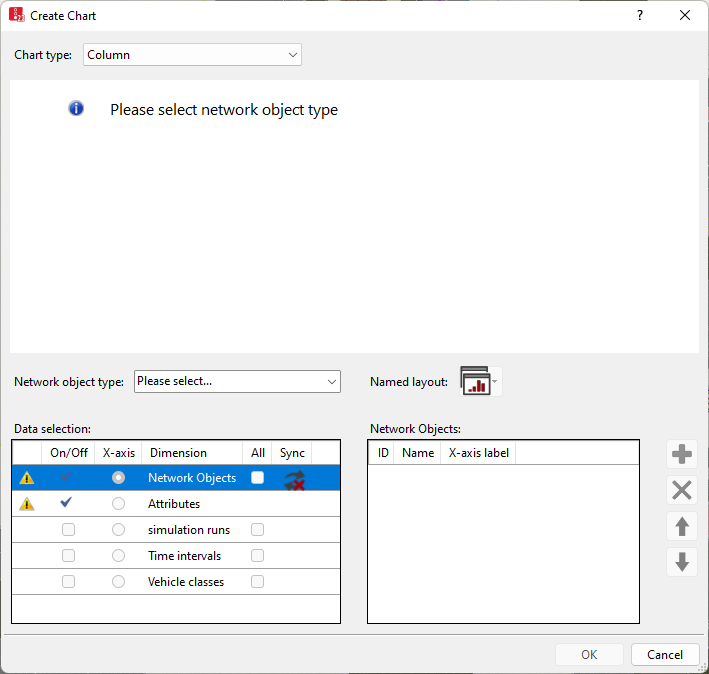
The Create Chart window opens.

2. Select the desired entry in the Chart type list box:
- Bar chart
- Line chart
- Original: Resets the chart display to the original data series graphic parameters. Only shown when data for different attributes is displayed in bar charts and line charts, for example after you have changed the Data series graphic parameters (Adjusting how the chart is displayed).
3. Select the desired network object type, base data type or result data type as the basis for further data selections in the Network object type list box.
In the next steps, in the left-hand Data selection area, configure the dimension, whose objects you can select in the right-hand area.
4. In the Data selection area, please note the symbols:
-
 No attribute references are selected yet. Please add attribute references.: In the right-hand area, no objects have been selected yet for this dimension. You cannot close the window with OK. Select objects for the dimension or select another dimension.
 -
 This net object type does not have any attributes which depend on simulation runs: The objects of the selected object type Simulation runs, Time intervals, Vehicle classes or Pedestrian classes do not have attributes which depend upon this dimension. You can only select simulation runs, time intervals, vehicle classes or pedestrian classes if the selected network object type, base data type or result data type has attributes that depend on this dimension.
5. In the Data selection area, set the desired settings:
| Column | Description |
|---|---|
|
On/Off |
Enable selection of objects for this dimension. If this option is selected, you can select objects for this dimension with the (+) button and add them to the area to the right. This option is always selected for Network objects and Attributes because you always have to select at least one network object and one attribute. |
|
X-axis |
Select a dimension whose selected objects will be plotted on the X axis. If the This net object type does not have any attributes which depend on simulation runs symbol is not displayed, you can select the x-axis option for Simulation runs, Time Intervals, Vehicle types or Pedestrian types and use the (+) button to select at least one object and add it to the area to the right. The selected dimension is shown above the area to the right as a title. |
|
All |
If this option is selected, all objects of the selected object type are selected. The objects are displayed in the area to the right. If you define new network objects in the Vissim network, they are automatically added to the chart. This option is not possible for attributes.
|
|
Sync
|
Synchronized object selection: If this option is selected and objects displayed in the chart are selected in a network editor or a list, the chart also shows this data as selected. |
The title of the area on the right shows the dimension chosen in the Data Selection area on the left.
In the next steps, in the section to the right, select the objects which you want to plot on the x-axis and for which you activated the option in the Data Selection area to the left in the x-axis column.
- Network Objects: Select the network objects of the network object type which you selected in the Network object type list box. If you selected a network object type from which only objects are available, e.g. Network performance, you cannot select, sort or delete any individual objects in the the right-hand section.
- Attribute: Select the attribute of the selected network objects. Attributes you have already selected are also displayed. These, however, cannot be selected.
- Simulation Runs: If desired, select simulation runs to be used as sources for the attribute values.
- Time Intervals: If desired, select time intervals to be used as sources for the attribute values.
- Vehicle Classes or Pedestrian Classes: If desired, select classes to be used as sources for the attribute values.
6. Select in the right-hand area the objects you want:
| Element | Description |
|---|---|
|
|
Open the <Name Object type>: Select Object(s) window, in which you can select the objects you want.
|
|
|
Move selected objects downwards in the right-hand list |
|
|
Move selected objects upwards in the right-hand list |
|
|
Delete selected objects in the list on the right |
A chart preview is displayed when data has been selected in the area on the right and the data selection is valid. The selected objects are plotted on the X axis.
7. If you do not wish the x-axis to be labeled with the object name, in the X-axis label column, enter the name of your choice.
8. To apply a named chart layout in the chart, in the Named layout list box, click the desired entry (Using named chart layouts).
9. Confirm with OK.
The Create Chart window closes. The Chart <title> window opens in the Vissim GUI. The chart is displayed.
Superordinate topic:


