After the start screen, the program interface of Visum will appear during program start which includes any other windows. The Network editor window (Network editor window) opens with an empty network including a satellite image of the earth; depending on the settings, other windows may be open (Making settings for windows upon opening version files or program start). Then you can, for example, read a network version from file (Opening a version file).
|
Note: If you start Visum by double-clicking a version file in the Windows Explorer, the corresponding network version is immediately opened. |
|
Note: A separate window opens when you choose to work with lists, the timetable, the matrix editor, the procedure sequence, the signal time-space diagram, the junction editor, transfers display of regular services or a schematic line diagram (Other windows). |
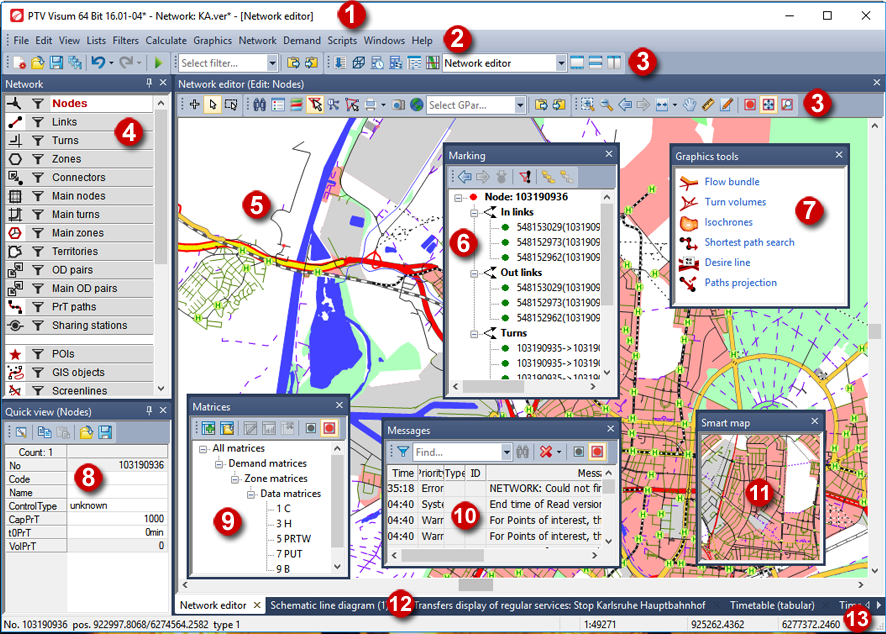
(1) Title bar
Here, name and version number of the program are displayed as well as the name of the opened file and – in brackets – the name of the currently active window.
(2) Menu bar
Via the menus, you can call the program functions. The menus provided on the menu bar depend on the currently active window. The commands provided on the Edit menu depend on the currently selected object type.
(3) Toolbars
Via the tool bars, you can call the program functions. The toolbars displayed depend on the window that is currently active (Tool bars).
(4) Network window
Here you select an object type, enable or disable the graphical display of network object types or graphics object types, and set filters for each network object type. Additional functions are available via the shortcut menu (Network window).
(5) Network editor window
The Network editor window shows the network currently open. Here you can adjust the display and edit the network graphically (Network editor window and Editing the network). Using the scroll bars, you can move the currently displayed network section horizontally or vertically.
(6) Marking window
This window allows you to access network objects that refer to currently highlighted network objects (Marking window).
(7) Graphics tools window
You can use the Graphics tools window to work with the following interactive, graphical evaluation tools:
- Flow bundle (Displaying flow bundles)
- Turn volumes (Displaying turns, main turns, and turn volumes)
- Isochrones (Displaying isochrones and the accessibility of network objects)
- Shortest path search (Searching for and displaying shortest paths)
- Desire line (Displaying desire lines)
- Paths projection (Projecting PrT path volumes)
(8) Quick view window
Here the attribute values are displayed for the currently highlighted network object. In the Quick view window, you can edit the attribute values of the highlighted network objects (Quick view window).
(9) Matrices window
This window gives you an overview of your matrices and allows you to edit them (Matrices window).
(10) Messages window
This window shows messages, warnings and notes. Its list entries allow to quickly jump to the respective position in the Network editor window (Messages window).
(11) Smart map window
In small format, this window shows an overview of the total network (The Smart map window). The section shown in the Network editor window is displayed as a rectangle (or as cross lines) in the Smart map window. The smart map provides quick access to a certain network section (Refreshing the view).
(12) Tab bar
With the window configuration Arrange windows as tabs, the tab bar shows all windows open. To open windows, you can also select them via a list box on the Windows toolbar (Toggling between windows). To toggle between windows, click the respective tab.
|
Tip: You can close a window by clicking the tab with the middle mouse button. |
(13) Status bar
The status bar contains various data:
- Details on the highlighted network object if only a single network object is highlighted
- Number of highlighted network objects if several network objects have been highlighted
- Commands for network processing steps
- Network scale (Editing the network scale)
- Coordinates of the pointer in the network
