The tabular timetable consists of two or three tables arranged on top of each other Image 271 on the one side and a list view on the other. The table columns are linked and show vehicle journey data, including vehicle journey sections and vehicle journey items across all the tables. The table rows contain attribute or stop event values.
The table vehicle journey attributes
The top table contains vehicle journey attributes or objects that are connected to vehicle journeys via relations. You can choose attributes and formats freely, as in lists. Using the graphic parameters, you can adjust and classify the display to distinguish between vehicle journeys of different operators or transport systems, or to evaluate vehicle occupancy. Similar to in lists, you can group the vehicle journeys by the attributes of your choice. This is done by applying aggregate functions to the vehicle journey attributes. A special grouping type is the so-called regular service mode. Here, vehicle journeys are grouped based on calculated or specified headway patterns.
In the table, you can edit vehicle journey attributes. By marking multiple rows, you can edit multiple vehicle journeys at the same time. The shortcut menu contains several editing functions for the marked vehicle journeys. In the timetable window, you can use the toolbar buttons to specify whether and how the marked vehicle journeys shall be marked in the Network editor. If you have activated synchronization, the Quick view window will also show the selected attributes of the vehicle journeys you marked. The marked vehicle journey data can be copied to the Clipboard. From there it can be pasted into a network loaded in a second instance of Visum. All connected objects (time profiles, line routes...) are also copied and pasted.
The table vehicle journey section attributes
You may optionally show the middle table with the vehicle journey section attributes. Its structure is similar to the top table, but it contains vehicle journey section attributes. If a vehicle journey has multiple vehicle journey sections, columns are added horizontally in the vehicle journey sections table, so that each vehicle journey section is displayed in a separate column.
In the table, you can edit vehicle journey section attributes that are lightly highlighted. By marking multiple rows, you can edit multiple vehicle journey sections at the same time. The shortcut menu contains several editing functions for the marked vehicle journey sections.
The table vehicle journey items
The bottom table shows vehicle journey items. You can switch the between the vehicle journey and vehicle journey section displays. In both views, the table rows show the stop events of the stop sequence. If you have activated the two-line display for stop events, two lines are displayed accordingly. In the stop sequence options you can set whether stop events are to be based on the level of stop points or stops (User Manual: Basic stop sequence settings)
Display of vehicle journey items
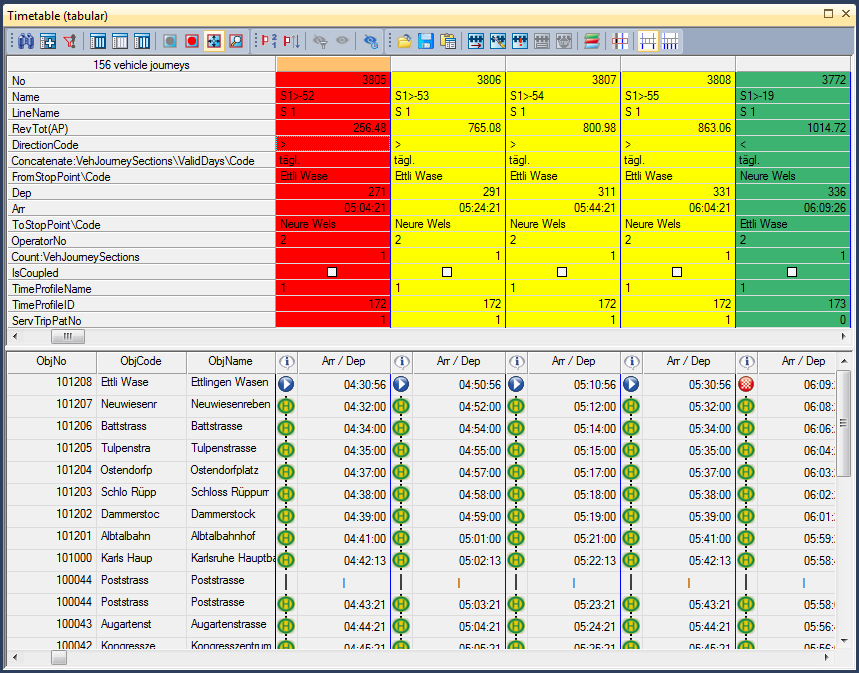
In the vehicle journey display, in the columns, attributes are shown that correspond to the stop events of the vehicle journey items. This, however, is only the case if the stop events are serviced by means of the vehicle journey. In the default view, the departure time is output next to the the stop event. However, you may choose to show any other vehicle journey item attributes such as boarding or alighting passengers. For twin stops, you can select additional, generally arrival-related, attributes to show in the additional row. A symbol in the left margin of the column indicates whether the vehicle journey attribute value refers to the start of the vehicle journey, is departure-related, or arrival-related.
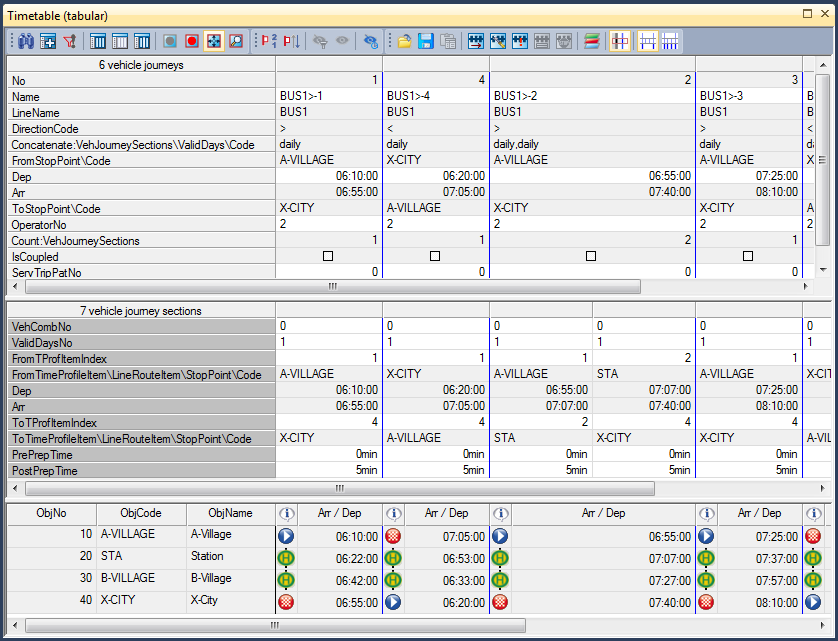
Image 271: Tabular timetable in the default view with vehicle journey items
Display of vehicle journey section items
In the vehicle journey sections display, in the items table, the columns are organized as in the vehicle journey sections table. This view does not show any attribute values, but only the symbols representing the the stop type: journey start, journey end, departure, arrival. It allows you to instantly see which vehicle journey sections service which vehicle journey items.
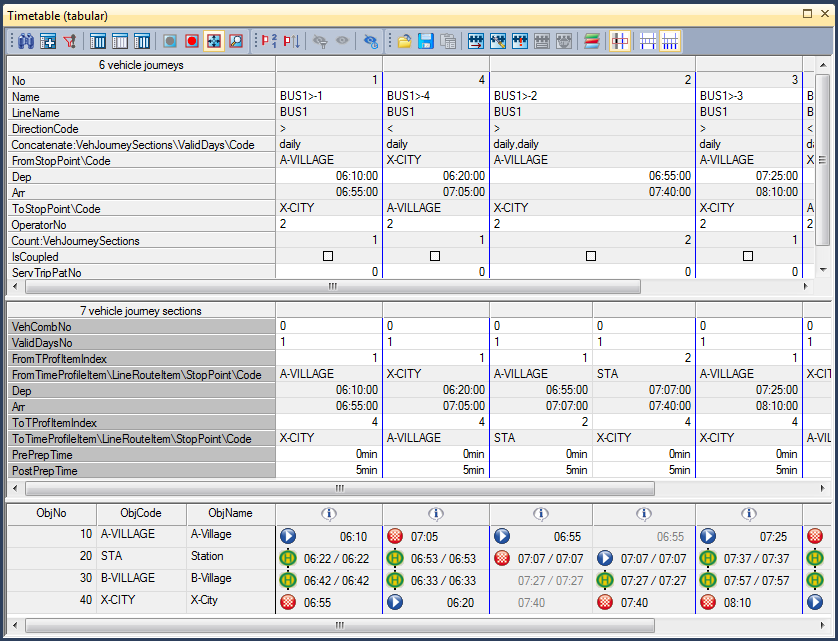
Image 272: Tabular timetable in the default view with vehicle journey section items
In the regular service mode (User Manual: Managing vehicle journeys and vehicle journey sections) all vehicle journeys are displayed as regular services with the additional attributes Headway start, Headway end, Headway time and Number of vehicle journeys (Image 273).
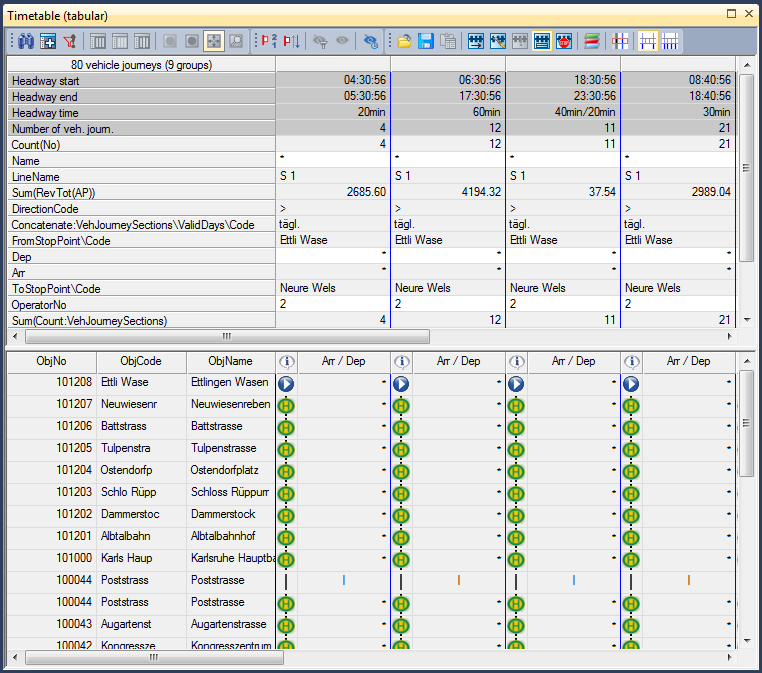
Image 273: Tabular timetable in the regular service mode
You can also display the columns of the tabular timetable as classified (User Manual: Specifying basic settings for the Network editor window). In the following example, the table background is classified by revenues (Image 274).