The SCENARIO workspace allows you:
- To manage several simulation groups, which are built by associating different scenarios.
- To run different simulations and compare them with the real traffic data simulation - which is usually called Base Simulation.
Before proceeding, you need to know how to define a scenario:
Main workflow
In the CREATE accordion pane:
-
Choose the simulation engine:
- REAL TIME
- OPTIMA PLANNING
- OPTIMA MICRO
- In the Simulation group name text-field, insert the name of the simulation group.
-
Build your simulation group:
- From scratch (→ Building a simulation group).
- Starting from a previously stored template which you can select from the Load from a previous group combo-box.
-
According to the selected simulation engine, set the specific options.
-
Select the QUEUE accordion pane to monitor the simulation's progress.
-
Run the simulation (→ Running a simulation group).
-
Select the DATA RESULTS accordion pane to get the results.
Workspace structure
The workspace is based on three accordion panes:
1. CREATE: to create a new simulation group.
2. QUEUE: shows the current state of simulation groups.
3. DATA RESULTS: shows a list of all already-simulated simulation groups.
Multiple simulation engines can be installed on the system, and each engine corresponds to a scenario evaluation execution mode:
- REAL TIME
- OPTIMA PLANNING
- OPTIMA MICRO.
The engine is selectable from the Search for... drop-down menu.
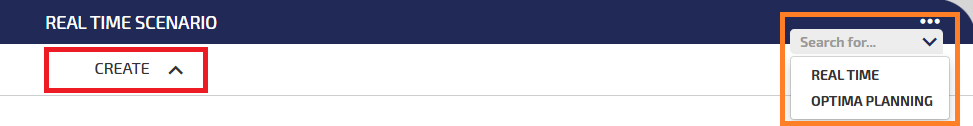
By default, the REAL TIME scenario opens.
Important: Each engine hosts the definition of specific parameters and dedicated data structures, but the results are parsed to provide a homogeneous set of values in order to display the same objects and charts for all engines.
Several operations are available to manage the simulation groups.
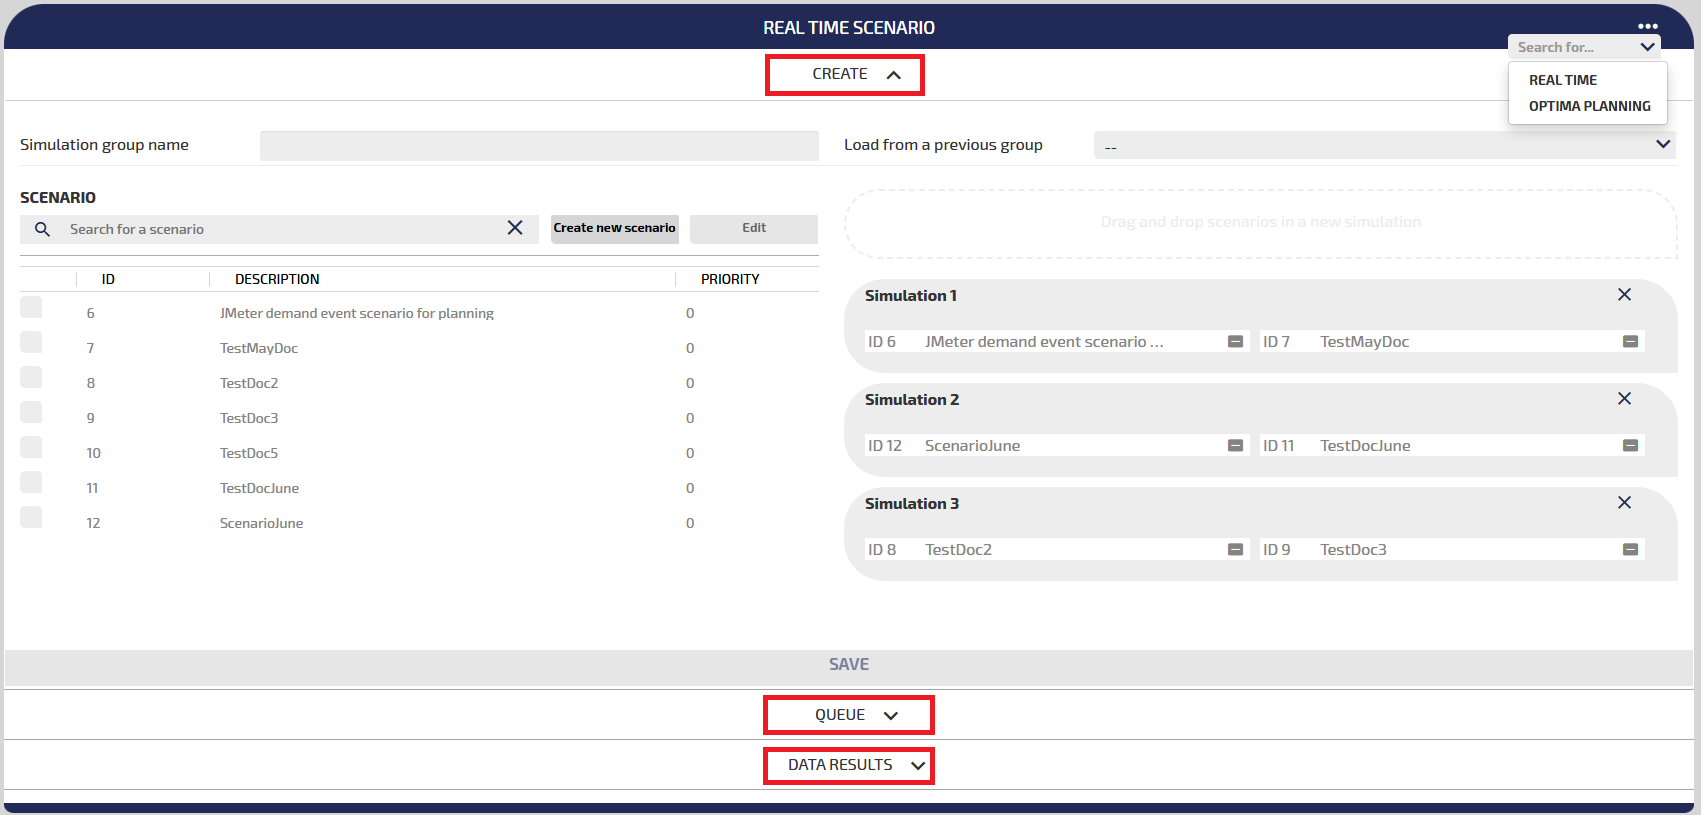
The CREATE accordion pane is structured in three main areas.
Definition Area
The area hosts:
- A Simulation group name text-field, to set the identifier of a simulation group.
- A Load from a previous group combo-box, which shows existing simulation groups that are usable as templates when creating a new simulation group.
- In the case of the OPTIMA MICRO engine, a Subnetwork drop-down menu to select the subnetwork area.
-
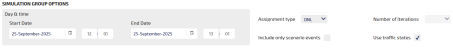
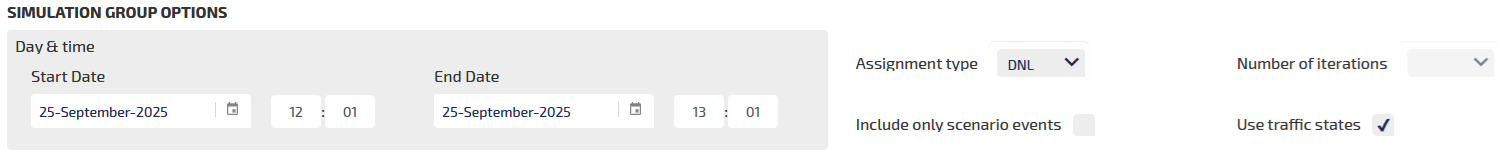
In the case of the OPTIMA PLANNING engine, a set of a SIMULATION GROUP OPTIONS:
Option
Description
Calendar
Set the date and the time period (start time - end time) for the simulation group.
Tip: The size of the time interval can have a meaningful impact on the performance of the simulations. The greater is the interval (endTime-startTime), the slower the calculation of the results may be.
Assignment type
Set the type of traffic assignment model:
- DTA (Dynamic Traffic Assignment): More than one iteration is necessary. You must select this option if it is necessary to calculate a new equilibrium.
- DNL (Dynamic Network Loading): Only one iteration is necessary.
Number of iterations
Set the number of iterations for the simulations group.
Include only scenario events
By ticking this check-box, the simulation also considers real events happening in the network (additionally to the ones defined in the simulations).
Use traffic states
By ticking this check-box, the simulation considers the real time data associated with the available traffic states for the simulation interval.
Important: In some situations, traffic state events may prevail over the events associated with the scenario.
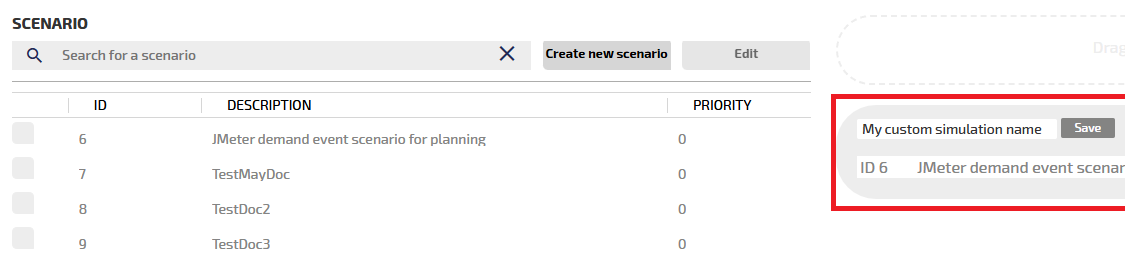
The SCENARIO Area
The area hosts:
- The list of all available scenarios
- The search engine to filter the scenarios
- The Create new scenario button.
- The Edit button to edit a selected scenario.
The Simulation groups Area
The area hosts the simulation groups that you can build by simply selecting a scenario (left click) and dragging it into the Drag and drop scenarios in a new simulation white dashed area.
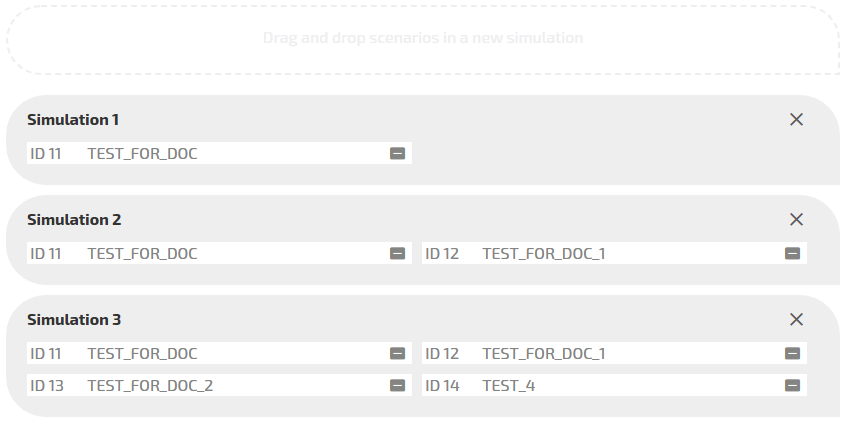
In the image, three distinct simulations groups are displayed, respectively made up of one, two, and four different scenarios.
Each simulation is represented by a gray box listed vertically. If you want to add a scenario to an existing simulation, the scenario can be dragged into the related simulation box.
You can include up to five different simulations into a single simulation group, which is always made up of:
- Up to four "explicit" simulations, built by grouping scenarios as shown.
-
Only one "implicit" simulation, the Base Simulation.
"Base" is just the simulation to be considered as the reference scenario.
The Base Simulation refers to the state of the real network in the “no-modifications” scenario.
The Base Simulation is listed in the list of simulations shown in DATA RESULTS (framed in RED in the Workspace image above).
Tip: After the setting of the four "explicit" simulations, the white dashed area shows the label Maximum number of simulations reached – cannot add simulations.
How to save the settings?
The SAVE button is only enabled when you set:
- The simulation group name in Simulation group name
- At least one simulation in the Simulation groups Area.
After SAVE, the simulation group is listed in the QUEUE accordion pane.
The QUEUE accordion pane hosts the list of simulation groups.
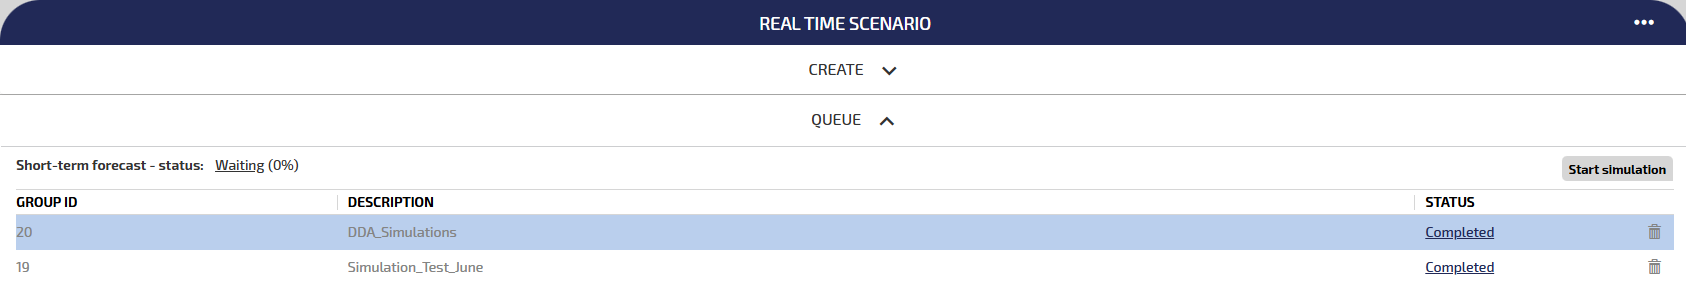
You can select one simulation group and click Start simulation (during the run, the waiting icon is shown).
In the STATUS column, click on Completed to automatically open the DATA RESULTS accordion pane.
Important: The listed simulation groups are automatically run - after a configured time period - according to the queue of the simulation engine.
In the case of the OPTIMA PLANNING or OPTIMA MICRO engine, the Start simulation button is not present.
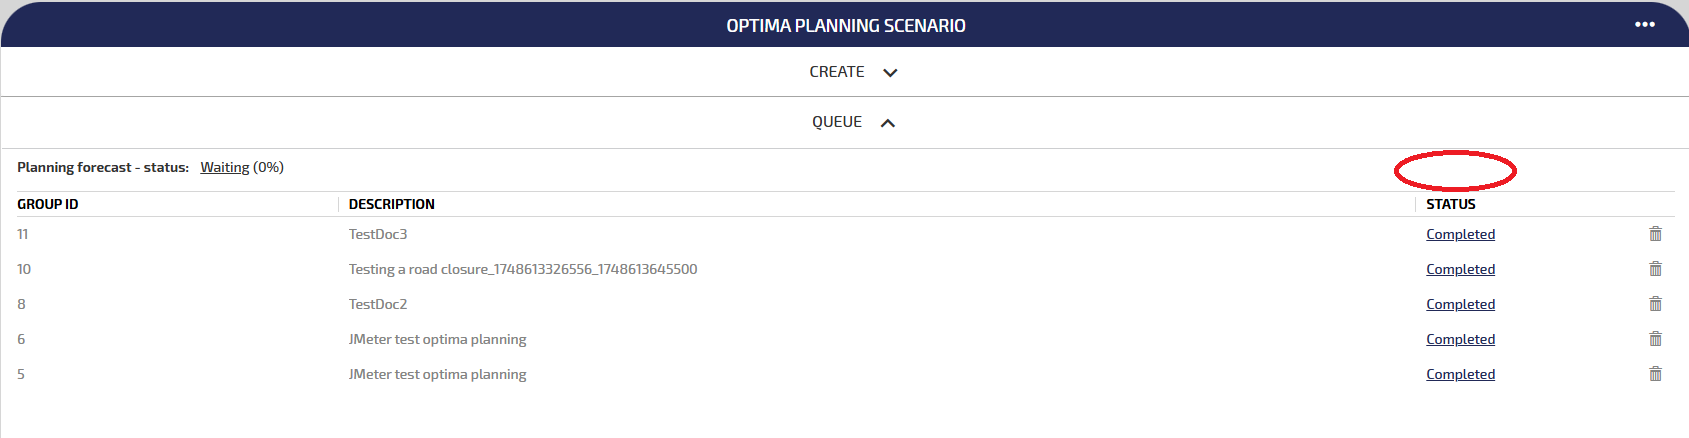
The simulations start running, as soon as a new simulation group is saved, in the CREATE accordion pane. You don't need to click any buttons.
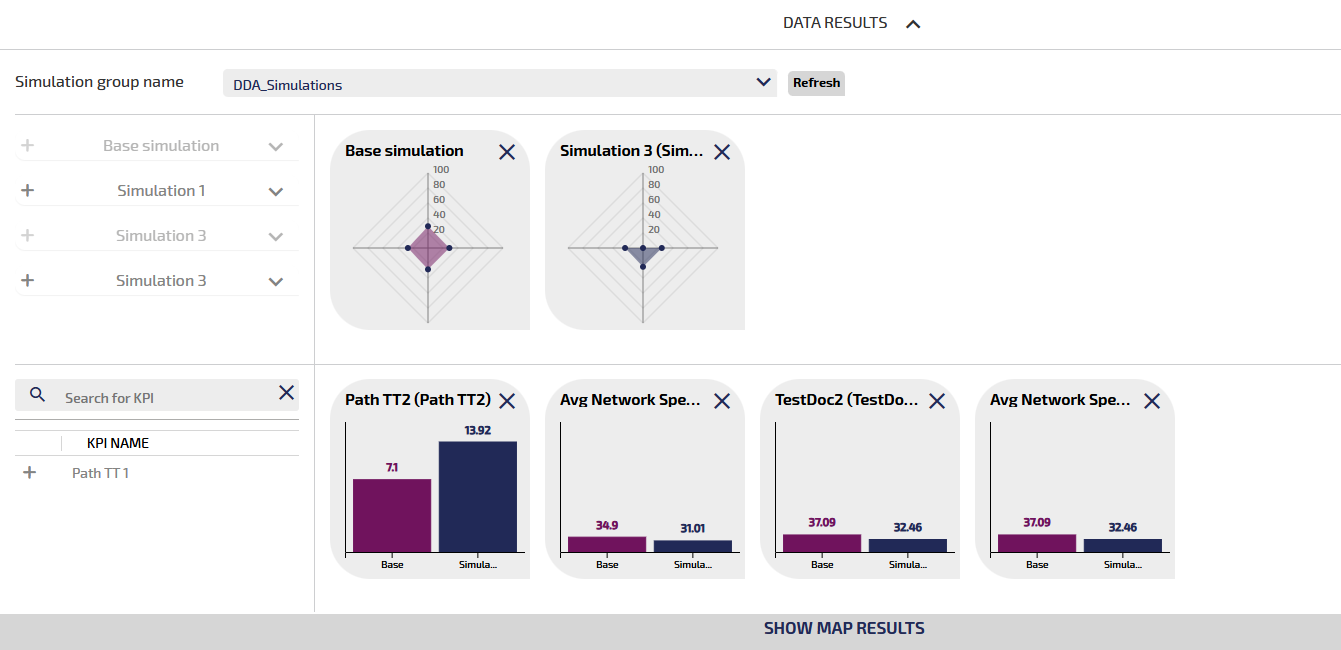
The DATA RESULTS accordion pane shows the results related to the simulation groups.
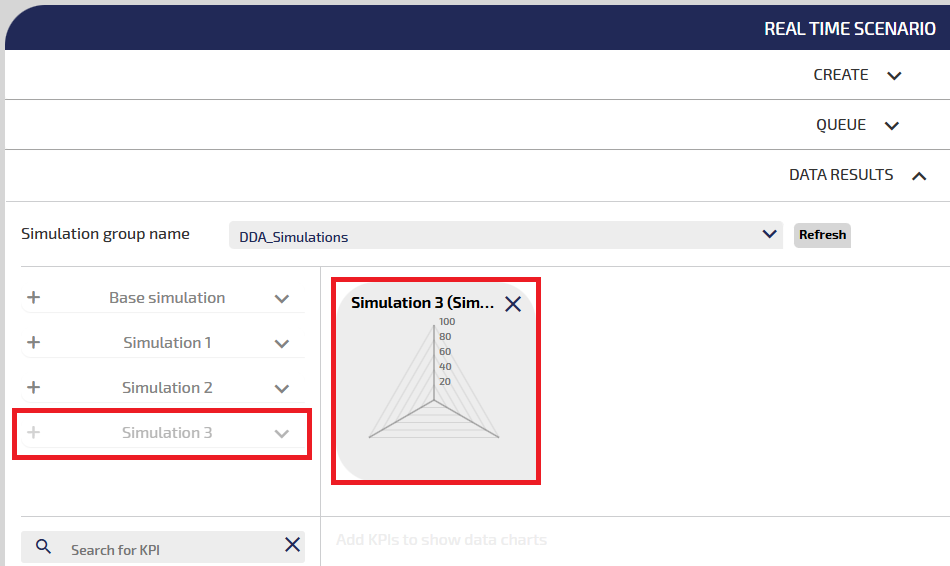
In particular, it shows a list of all already-simulated simulation groups, and, for each one, it allows the user to compare simulations and KPIs in order to check the differences between results.
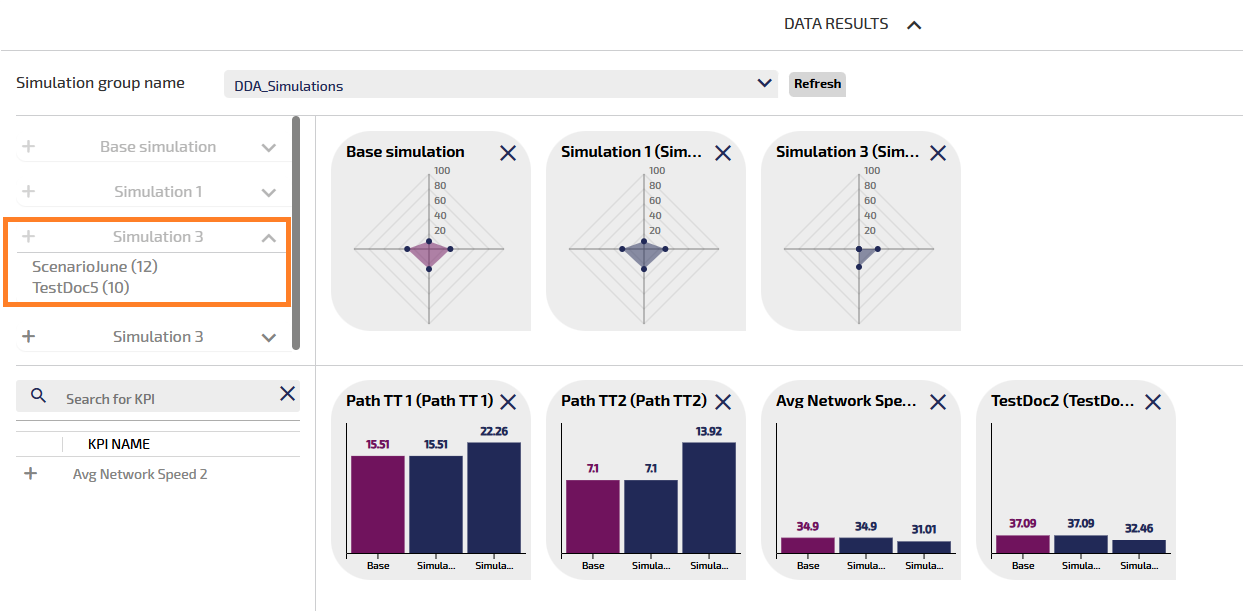
To activate the diagram of a KPI, you must click it on the left-side list, enclosed in the orange box.
The Base Simulation is represented by the PURPLE graphic elements:
- The web diagram.
- The associated default KPI histograms.
In the following image, a couple of DARK BLUE histograms are also represented in association with the simulation Simulation 1 (enclosed in the green boxes).
The value associated with the PURPLE and DARK BLUEhistograms are also shown through the associated vertex on the web diagram.
In the image, the web diagram associated with Simulation 1 contains only two values because this simulation only has only two associated KPIs.
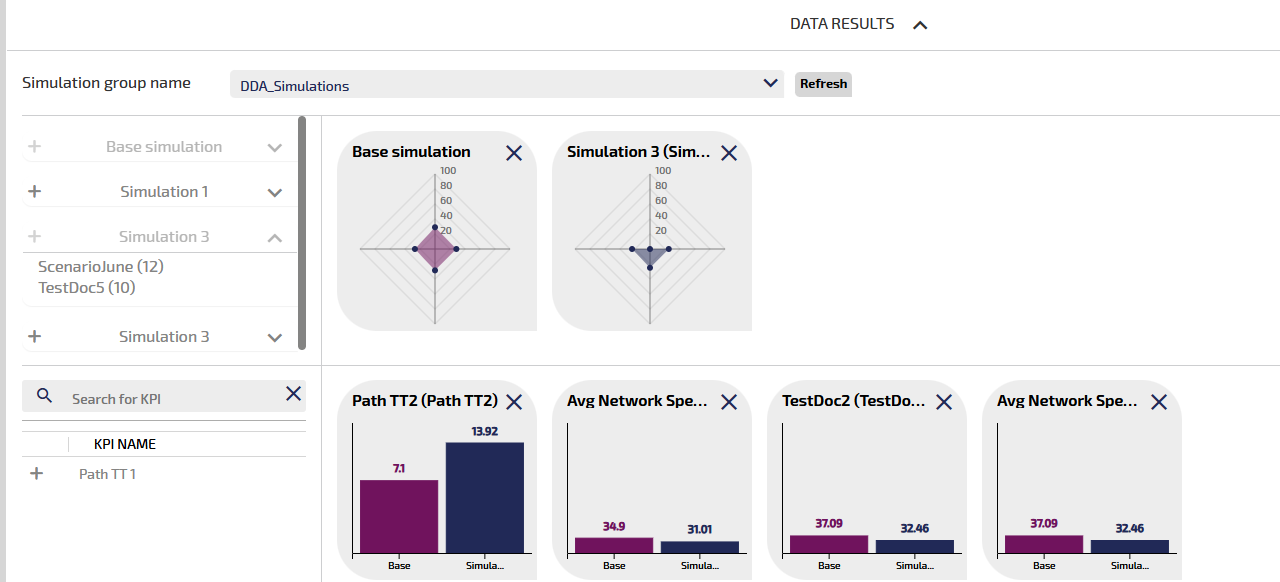
Important: In order to produce a web diagram, there must be at least three KPI values>0.
This example shows a simulation associated with three distinct KPIs:
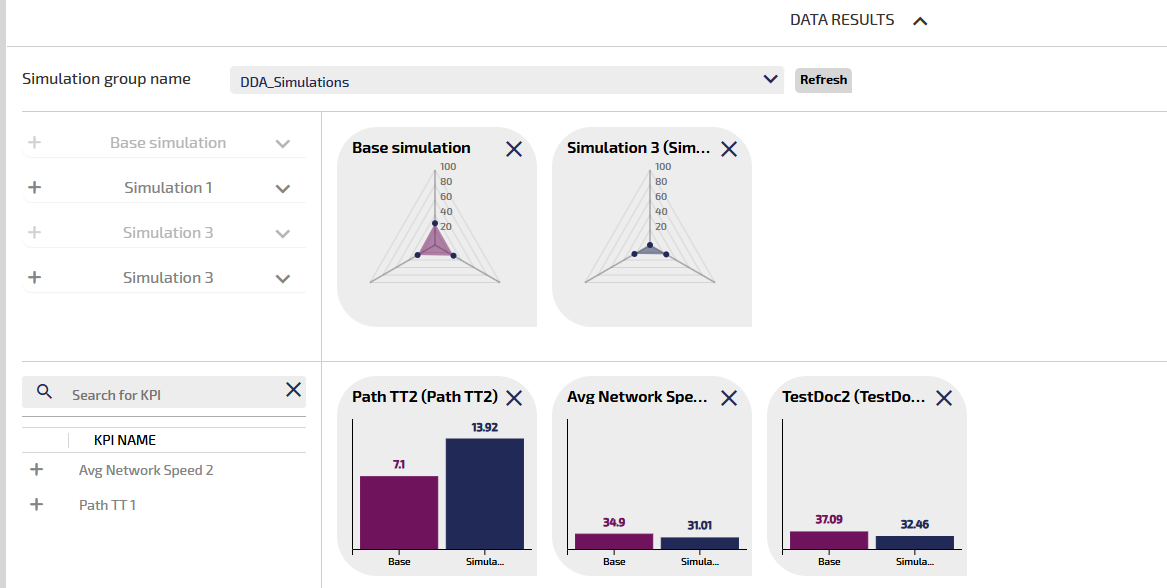
With three distinct values, the web diagram of Simulation 1 appears as in the case of the Base Simulation.
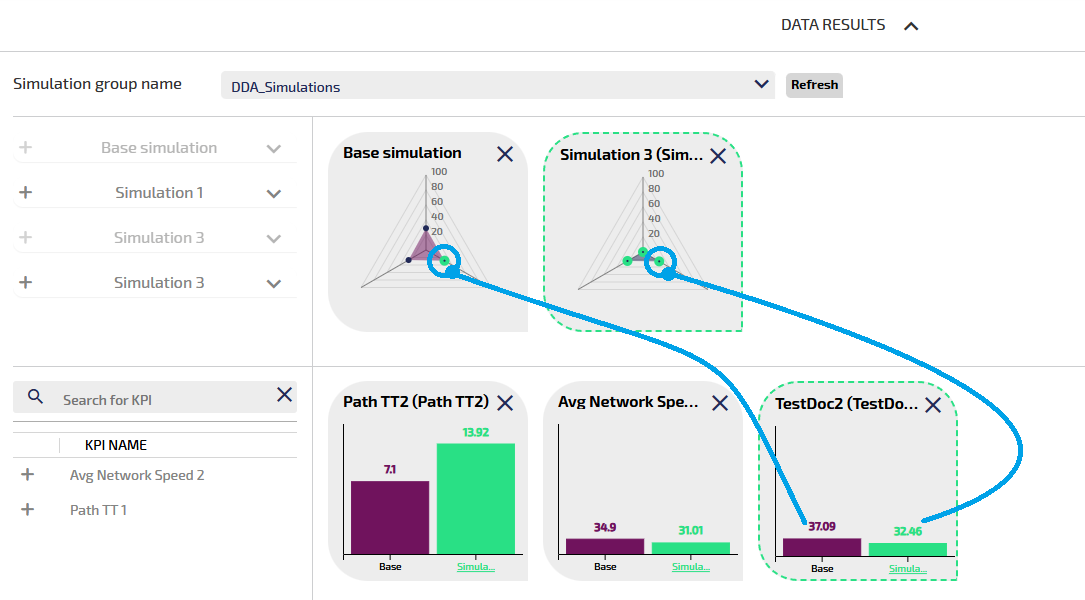
By clicking on the web diagram, you can change the color from dark blue to green.
By clicking on a specific KPI (histograms), you can highlight the associated values in the web diagram:
Here is another example with a simulation group added to the Base Simulation:
This is one more example with a simulation group being, however, built with two distinct scenarios (see the ORANGE box on the left), and added to the Base Simulation:
In the case of the OPTIMA MICRO engine, the KPIs shown are predefined and associated to the values returned by the API → Getting status, configuration or KPI results of a simulation group.
In the SCENARIO workspace, you can perform several operations.
It is possible to add a new scenario starting from the SCENARIO workspace.
- Open the CREATE accordion pane.
- In the SCENARIO Area, click Create new scenario.
- The Scenario window opens. It allows you to define all attributes of the scenario (see → Scenario management).
- At the end of the scenario creation, the new scenario is listed in the SCENARIO Area.
- Open the CREATE accordion pane.
- In the SCENARIO Area, select a specific scenario from the list.
- Click Edit.
- The Scenario window opens (see → Scenario management).
-
Modify the attributes of the scenario, therefore click SAVE.
You can include up to five different scenarios (simulations) in a single simulation group, which is always made up of:
- The Base Simulation.
- Up to four additional explicit scenarios (at least one).
- Open the CREATE accordion pane.
-
If necessary, run the procedures:
-
In the SCENARIO Area, select a specific scenario (left click) from the list and drag it into the Drag and drop scenarios in a new simulation white dashed area.
A gray box opens automatically. It hosts the dragged scenario. Every gray box is a simulation group.
- Repeat step 3 to build simulation groups consisting of a single scenario (other than the Base Simulation).
-
If you want to add a scenario to an existing simulation group, select (left click) a specific scenario and drag it into the gray box associated with the simulation group.
The gray box is automatically updated with the new scenario.
-
Click SAVE.
The simulation group is listed in the QUEUE accordion pane.
- Select a simulation group in the QUEUE accordion pane.
-
Click Start simulation
During the run, the waiting icon
is shown. - When the run is completed, click on Completedin the STATUS column to automatically open the DATA RESULTS accordion pane.
- Open the CREATE accordion pane.
- In the SCENARIO Area, select a specific simulation group.
-
Double-click on the name of a simulation group.
The simulation group name becomes a text field and you can edit it:
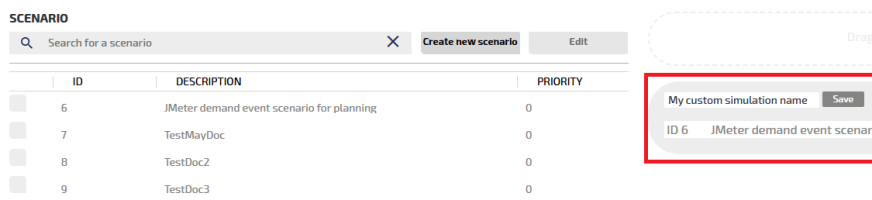
-
To save the new name, click SAVE.
- Open the CREATE accordion pane.
-
Select the OPTIMA MICRO engine from the Search for... drop-down menu.
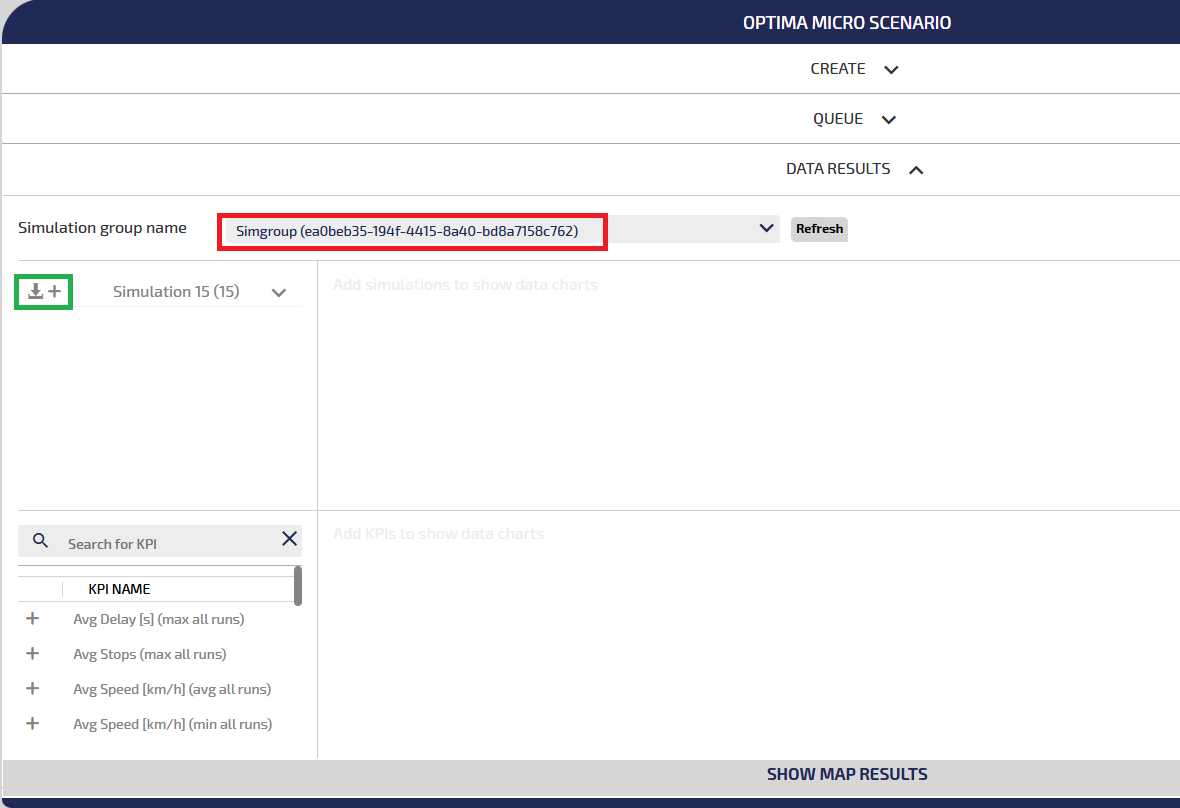
- Open the DATA RESULTS accordion pane.
-
Select a simulation group from the Simulation group name combo-box.
-
For each simulation in the list, you can click the leftmost icon: Download simulation data (green rectangle).
You are redirected to a page to download the .zip file.
For more details about the contents of the .zip file, see → Result of the process.
Important: This feature is available ONLY if you have configured the parameter executeSimulationsWithWorkflow (→ Global configurations).
- Select a simulation group in the QUEUE accordion pane.
-
Click Start simulation
During the run, the waiting icon
is shown. - When the run is completed, click on Completed in the STATUS column to automatically open the accordion pane DATA RESULTS.
- In this area, you can find the (disabled) button: execute workflow.
-
Drag a simulation into the charts section.
The associated Radar charts are shown.
- Select a simulation radar chart to enable the button execute workflow.
- Click execute workflow to run the workflow manager service.
The workflow manager service is based on:
service url name: "simulationWorkflowExecuteService"
method: POST
contentType: "application/json"
body: {"simulationId": "<id_of_the_selected_simulation>" }
This service can be invoked by an external application.
Topics in this section