Optima provides to the user a quality measure of the forecast produced with a specific Optima forecast engine.
The indicator compares the results of the forecast simulation with the real time measurements.
Currently these indicators are provided for two forecast engines:
- Short-Term Forecast (STF)
- Machine Learning Forecast (MLF).
The quality measure can be associated with two specific traffic parameters:
- Traffic Speed
- Traffic Flow
The main steps of the process are illustrated in the figure:
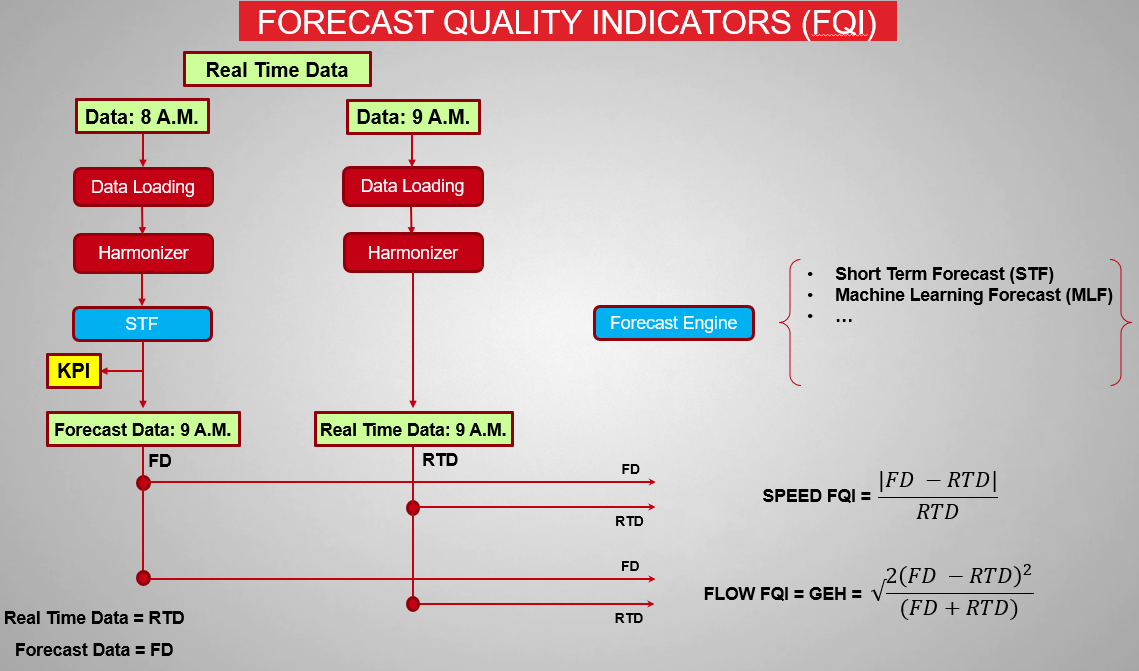
The red rows show the flow to calculate two distinct data, starting from data arriving from the field:
- The Forecast Data (FD)
- The Real Time Data (RTD)
The SFQI represents the absolute difference between the predicted value and the real measurement, normalized to respect to the absolute value of the real measurement (therefore, the relative error).
This number should never over exceed the value 0.2. (it is configurable value), that means that the forecast is forecasting a speed of 20% more or less than the actual value.
The higher the indicator value, the lower the forecast quality. For an ideal forecast: SFQI=0.
Speed = |forecast - measurement| / measurement
The FFQI is exactly the GEH value.
The Geoffrey E. Havers formula (GEH) is used in traffic forecasting, to compare two sets of measurements of traffic volumes and is an adimensional number.
A forecast associated to FFQI (GEH) value < 5 is considered a good forecast, while a forecast with FFQI > 10 is considered not reliable.
The higher the indicator value, the lower the forecast quality. For an ideal forecast: FFQI=0.
Flow = sqrt(2 * (forecast - measurement)^2 / (forecast + measurement))
KPI Dashboard
The user can monitor the results of quality indicators defining a KPI instance, starting from the templates dedicated:
- For TRE engine, see → Adding a KPI > MODEL FORECAST QUALITY (FLOW) - Provider: Short-Term Forecast.
- For MLF engine, see → Adding a KPI > MACHINE LEARNING FORECAST QUALITY (FLOW) - Provider: Optima Machine Learning Forecast.
The Forecast default template works on the entire traffic network. You can set new instances of the default template to calculate the value of the indicator associated to more specific areas.
Model Quality layer (Short Term Forecast) layer
The quality indicator results are shown on TS map in → Model Quality from Base layer.
Machine Learning Forecast Quality layer
The MLF quality indicator results are shown on TS map in→ Machine Learning Forecast Quality layer.
Topics in this section