You can initiate a data export and upload from a Visum network to Dashboards, an app in the PTV Hub web application. The data is then available for further analysis in Dashboards.
|
Note: To use the web application Dashboards, you need a user account and a license that includes the use of PTV Hub. Get in touch with us and receive a free trial account https://www.ptvgroup.com/en/products/ptv-hub. |
From Visum, you can export the following data to Dashboards:
- Network objects and their attributes
- Matrices
- Trajectories
- Intersections and movements
1. Make sure of the following:
- The network you want to export from has an Open Geospatial Consortium (OGC) compliant projection set up (Selecting a coordinate system and Coordinate systems)
- There are no empty geometries, for example, all polylines consist of at least two points that do not represent the same point.
- All geometries are within the allowed range of the projection.
- The number of trajectory objects for animation is reasonably limited. This will ensure that not too many vehicles are driving at the same time and that the animation runs smoothly. For example, you can record SBA trajectories only for a selection of active links (Simulation-based dynamic assignment: Visualization tab) or restrict public transport trajectories. Currently, 20000 simultaneous objects can be displayed in Dashboards without any loss.
2. From the File menu, choose Export. Then select Dashboards.
The Visum window opens, prompting you to sign in to your PTV user account.
3. Click the Sign in button.
A browser window opens with the PTV user account sign in page.
4. Sign in with your e-mail address and password.
5. Switch back to Visum.
The Dashboards export - Select data sources for scenario window opens on the Network objects tab.
6. If necessary, change the default selection of network objects and attributes using the Edit and Delete buttons (Changing the selection of network objects for export to Dashboards).
7. If necessary, open a saved selection via the Open selection button (Loading settings for the Dashboards export).
|
Note: If you have not previously selected the network object type belonging to the selected matrix, these are automatically added to the list of network objects to be exported with the key attribute before the export. |
The Dashboards export - Select network object attributes window opens.
9. From the Network object type drop-down list, select the desired entry.
10. In the lower part of the window, select the desired attributes of the selected network object type that you want to export (Selection of attributes)
|
Notes: If you select a subattribute for an attribute that has multiple variants, always select all variants and not just single ones. |
11. If necessary, select the Export only active objects option.
|
Notes: Aliases of attributes are exported automatically and are used as attribute names in Dashboards. You can insert aliases for attributes directly in the window by right-clicking the desired attribute and selecting Create alias from the shortcut menu. The attributes are exported in the language you have set for the Visum interface (Setting the language). The geometries of the relevant network objects are exported automatically so that they can be displayed on the map as usual. |
13. Repeat steps 8 to 12 to select other network object types for export.
14. Make your changes on the other tabs.
- Matrices tab (Dashboards export: Matrices)
- Trajectories tab (Dashboards export: Trajectories)
- Intersections and movements tab (Dashboards export: Intersections and movements)
15. If necessary, save your settings using the Save selection button(Saving settings for Dashboards export).
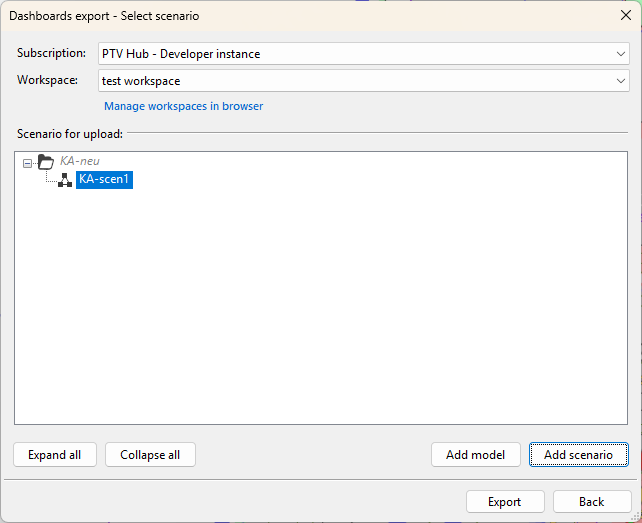
The Dashboards export - Select scenario window opens. A list of all available models with the corresponding scenarios is displayed.
|
Tip: The Back button takes you back to the Visum export settings to change or save them if necessary. |
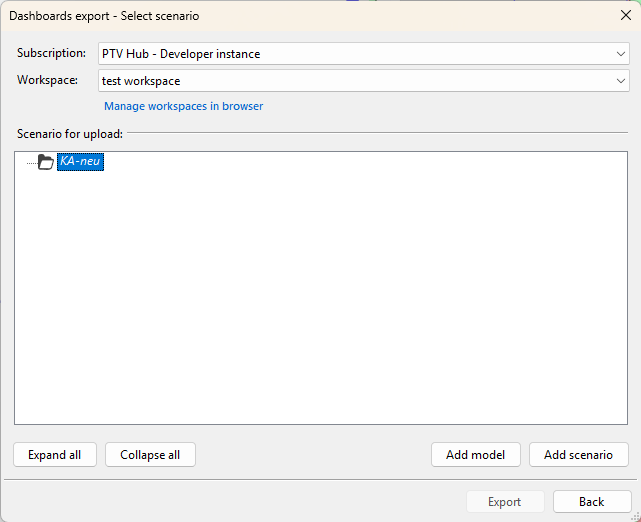
16. Select the Subscription you want to export to.
17. From the drop-down list, select the desired workspace to which you want to export the data.
18. Select the desired model or create a new model using the Add model button.
19. Select the desired target scenario or mark the desired model and use the Create scenario button to create a new scenario to which you want to export the data.
|
Note: If the target scenario already contains data, it will be deleted and replaced by the new data. The link from the old data sources to Dashboards that display them is retained and transferred to the new data sources. This allows you to quickly update a scenario's data and continue using dashboards you have already created. |
20. Click the Export button.
Visum exports the selected data. Subsequently, these are automatically uploaded by the Data Transfer Tool and prepared in Dashboards for display in dashboards (Using the PTV Vision Data Transfer Tool). Once Visum has exported the data, you can use Visum again.
