The profile view shows the chronological course of various activities. Activities can be line block items, vehicle journeys, DRT trips, or activities from ABM models. These activities have in common that they have a start and end time and that the location is known at both times. Individual activities are displayed on a time axis. Activities that overlap in time are displayed one above the other so that the y-axis shows the number of simultaneous activities at any given time.
You can classify the elements based on an attribute (User Manual: Specifying settings for profiles). The elements are then displayed in the view sorted according to their classifications. The spatial selection of activities is controlled by reference objects. The reference object filters the displayed objects according to their location. You can control whether a multi-selection of reference objects should be logically linked with "and" or "or". If no reference object is selected, the profile view considers the activities across the entire network. The display of activities is controlled by a formula filter that accesses any desired attributes. The selection of the time shows the number of activities in the legend separated by their classes. A disaggregated view is available below the profile view. This detail view dissolves the summary of the activities again and draws the individual activities separately. The selected class and, if applicable, the selected time limit the number of activities displayed. The detail view is synchronized with the network editor and all other views, so that when you select an element, the same element is highlighted in all other views.
The following figures show typical use cases of the activity profile. The first figure shows the network-wide evaluation of the vehicles used in a ride-sharing system and their occupancy over time:

The following activity profile from an ABM model shows activity executions filtered over an inner-city zone:

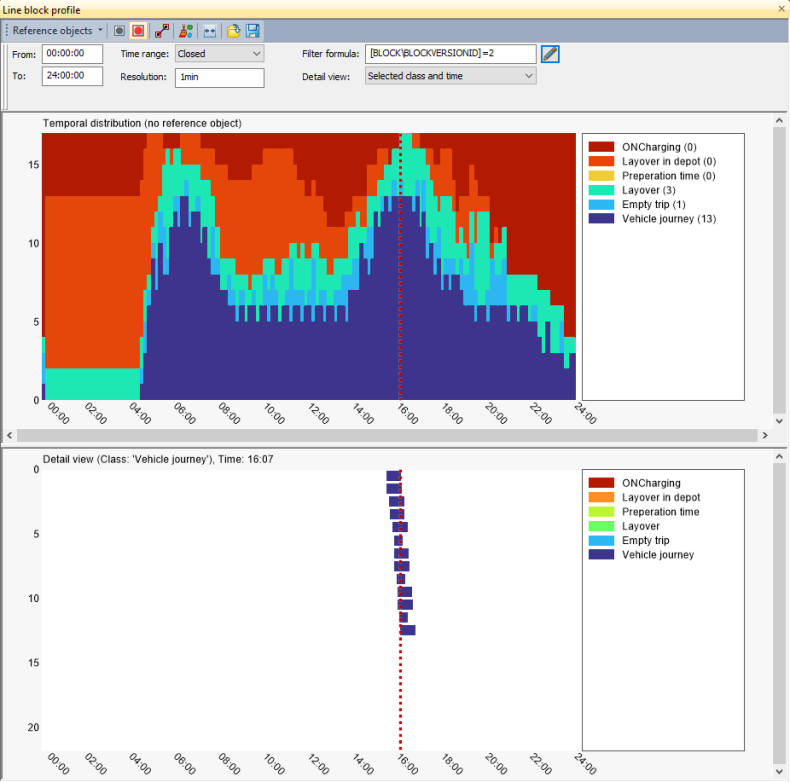
The following two figures show the results of a line blocking calculation. With the representation of the line block profile you visualize the activities of the vehicles used over time (upper figure). Filtered by location and activity, for example, it is possible to see how many charging activities are planned at the same time at the same location.

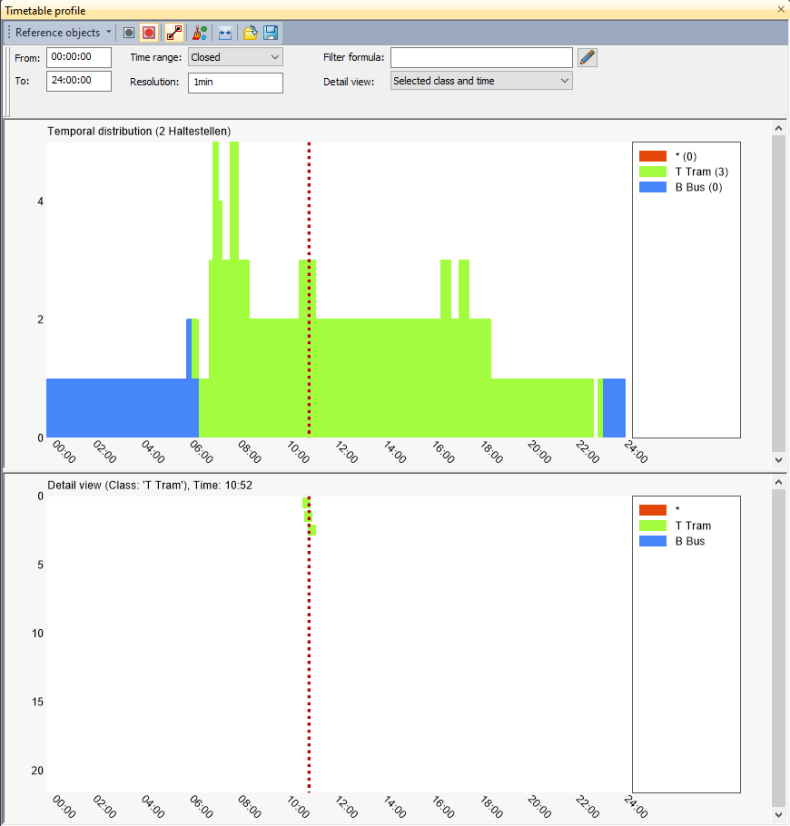
The timetable profile shown below uses two spatial reference objects, in this case stops, which are linked with a logical "and". Thus the figure shows the number of connections, classified by the transport system. In the example, the tram running during the day is replaced by a bus at night.