A screenline is a polygon, which can be inserted into the network by the user with any number of intermediate points. The screenline is inserted so that it intersects multiple links. The values of any attributes of all links, which are intersected by the screenline, can then be aggregated with the screenline. The following aggregate functions are thus available respectively for all or only for the active links (Indirect attributes).
- Number of links which intersect the screenline.
- Minimum of the values of the selected attribute from all links intersected by the screenline.
- Maximum of the values of the selected attribute from all links intersected by the screenline.
- Sum of the values of the selected attribute from all links intersected by the screenline.
- Mean of the values of the selected attribute from all links intersected by the screenline.
- Interlinking of the values of the selected attribute from all links intersected by the screenline.
The orientation of a screenline depends on the sequence of the polygon points along its course. It is always oriented to the right in the direction of creating. By default, arrow heads along the course indicate the orientation. For the aggregation, you can take into account all links in screenline orientation, all links against the screenline orientation, or all links, independently of the direction.
In the following example, the screenline intersects two links whose volume amounts to 1,000 and 3,000 persons. The screenline then aggregates the values of the links that it intersects. In the example it identifies a total of 4,000 persons in screenline orientation for all links and an average of 2,000 persons.

Image 33: Summation and average calculations with screenlines
With the aid of screenlines, you can for example determine the traffic that enters and exits the downtown area every day in a traffic engineering study which analyses the traffic volume of a downtown area. In Image 34, 149,334 vehicles in PrT and 76,370 persons in PuT are entering the downtown area.
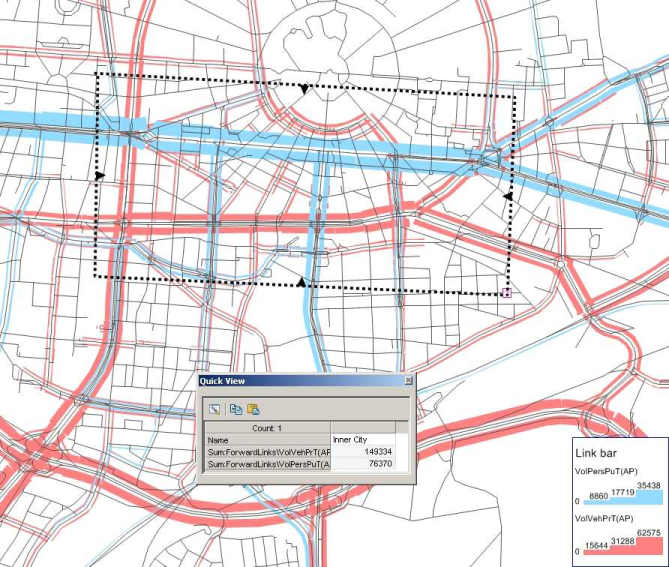
Image 34: Calculation of the urban traffic volume with screenlines
Screenlines are a useful construction to calibrate an assignment model by means of counted link data. A screenline aggregates all links intersecting it. This is useful for the calibration of the model as cumulative assignment volumes can be compared with cumulative link count data. When inserting screenlines, it is often recommended to adjust them to natural phenomena. A screenline could, for example, take the course of a river. For the calibration of the model, in principle, at least the sums of the volumes on all bridges should then agree throughout the day, even if the distribution of the volumes to the individual bridges (route split) can differ. With the aid of the assignment analysis, you can evaluate aggregated count data and assigned volumes of the screenline statistically (User Manual: Analyzing the assignment quality). With this analysis functionality, the efficiency of the calibration can be increased considerably.
