Report Layout
It is recommended, that you visit Report Layout and set up the configurations in the base scenario, before creating additional scenarios.

|
Tip: Save an empty seed file that includes your custom configurations and layout to use for each project. |
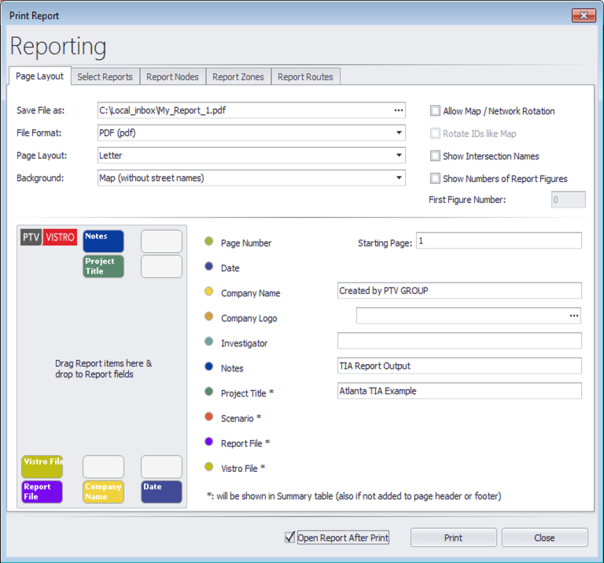
Report production can be initiated in the Reporting dialog window available from File > Print Report…:
Figure 44: Reporting Dialog Window

There are 5 tabs:
- Page Layout: Define the page layout and prepare for printing
- Select Reports: Select which tabular and graphical reports to include in the report
- Report Nodes: Select which nodes to include in the report and define hourly volume factors for signal warrant analysis at all unsignalized intersections
- Report Zones: Select which Zones to include in the report
- Report Routes: Select which optimization Routes to include in the report
The reports in PTV Vistro can be configured in a variety of ways in the Page Layout tab, as described in the table below.
Table 30: Report Layout Options
| Parameter | Description |
|---|---|
|
Save File as |
Select path and filename to store the report |
|
File Format |
Choose the format for the report. Options are:
|
|
Page Layout |
Choose the page layout (A4 or Letter) |
|
Background |
Choose the background for the figures. Options are:
|
|
Allow Map / Network Rotation |
Select to rotate the map and/or network. |
|
Rotate IDs like Map |
Select to rotate intersection IDs. |
|
Show Intersection Names |
Print Intersection Names above the bubbles in the figures generated in the report. |
|
Show Numbers of Report Figures |
Print numbers on the figures generated in the report. |
|
First Figure Number |
Set the number for the first figure in the report. |
|
Open Report After Print |
Select to open the report in the chosen format after printing is complete. |
|
|
Print / create the report. |
|
Cancel |
Cancel out of the dialog and return to the network. |
In addition, you can add headers and footers by dragging and dropping the elements to the placeholders on the Report page, as shown in the figure below.
Figure 45: Reporting Page Layout
Header and Footer data options are summarized in the table below.
Table 31: Report Headers and Footers
| Header / Footer | Description |
|---|---|
|
Page Number |
Pages are sequentially numbered for each page of the report. |
|
Starting Page: |
Indicate the number for the first page of the report. |
|
Date |
Current date |
|
Company Name |
Fill in your Company Name |
|
Company Logo |
Select an image file containing your company logo. Supported formats include ICO, BMP, JPG, JPEG, PNG. |
|
Investigator |
Fill in Investigator / Analyst name |
|
Notes |
Add any additional Notes about your project |
|
Project Title |
Fill in the Project Title. This will also be shown in the Summary Table of the report. |
|
Scenario |
Name of current Scenario |
|
Report File |
File name of the report being generated |
|
PTV Vistro File |
File name of the PTV Vistro network |
In addition, and by default, the report contains the text Generated with PTV Vistro and the PTV Vistro version number in the header.
Report settings are saved in the network file *.PTV Vistro.
The Mitigation reports are also accessible from the Mitigation Workflow Task Table (see section Trip Generation).
