Visualizing volumes on paths as flow bundles
You can visualize the volume on paths generated through dynamic assignment as a flow bundle.
- First, in the Network editor, add filter cross sections of the network object Flow bundles to the links or connectors of the paths whose volume you want visualize (Defining flow bundles and filter cross sections).
- Then configure the display in the graphic parameters of flow bundles or alternatively based on a color scheme for link bars (Graphic parameters for visualizing the volume on paths with flow bundles), (Displaying flow bundle bars).
The flow bundle visualizes the volumes of the last simulation run.
Examples
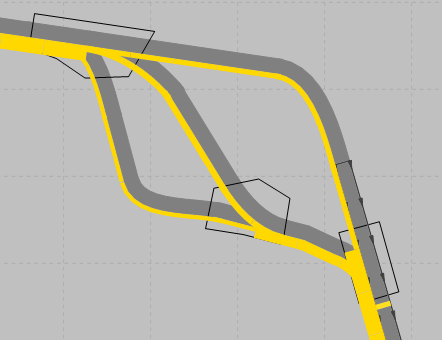
The figure shows a section of a Vissim network, with path volumes visualized as a flow bundle. The yellow filter cross section of the flow bundle has been placed and selected at the bottom right of the node. Parallel to it, the path volumes on the link are visualized as yellow flow bundle bars. The width varies depending on the path volume.
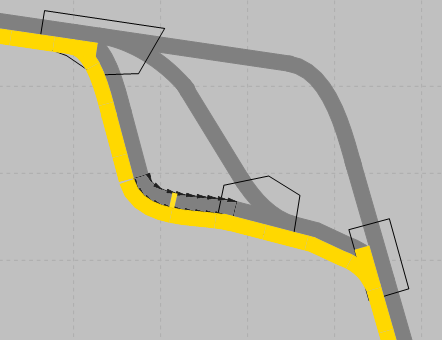
The figure below shows the same section. This time, the filter cross section of the flow bundle has been placed and selected on the left of the connector. There is only one path that traverses this connector.
Additional options to visualize evaluation results
- Color schemes for links (Assigning a color to nodes based on an attribute)
- Link bars (List of graphic parameters for network objects), (Attributes of links)
- Turn value visualization (Visualizing turn values)
