Showing signal times table in a window
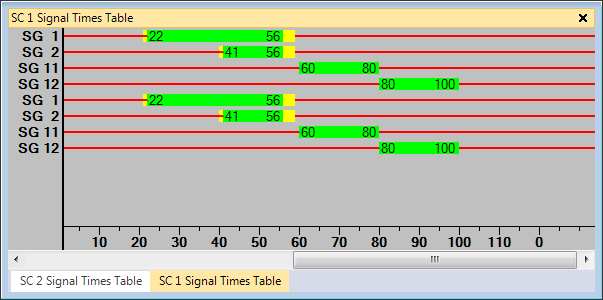
You can show the current signal states and detector states during a simulation or during interactive tests of signal control logic in a window. Therein, the green times, yellow times and red times are represented graphically along a horizontal time axis for each selected signal controller.
Signal controllers must be defined in the network (Modeling signal controllers).
1. Ensure that the signal times table is configured according to your requirements (Configuring signal times table on signal controller), (Configuring the display settings for a signal times table)
2. On the Signal Control menu, click > Signal Controllers.
3. Right-click the desired signal controller.
4. On the shortcut menu, click Show signal times table.
The Signal Times Table Windows window closes. The SC <no.> Signal times table window opens.
When you start the simulation, colors indicate the current status of the respective signal group.
The signal times table is processed from right to left. The processing speed depends on your simulation speed (Defining simulation parameters). The state of the current time step is represented at the right edge of the window. The numbers specify the start time and end time of signal states.
If the signal times table also contains detectors, the color of the detector indicates the occupancy state:
| Detector color |
Description of occupancy state |
|---|---|
|
Change from black line (empty) to light blue |
A vehicle passes the loop within a time step, rising and falling pulse edge within a simulation second. |
|
Change from navy blue to light blue |
A vehicle leaves the loop, and another vehicle enters the loop within the same time step, rising and falling pulse edge within the same simulation second. |
|
Light blue (several seconds) |
Several vehicles pass the loop within a time step, rising and falling pulse edge within a simulation second. |
|
Navy blue |
A vehicle is located on the detector at the end of the time step. Thus another vehicle enters the loop in the relevant second, but does not leave it again within the same second. A long navy blue bar means that a vehicle is on the detector. This corresponds to the character ‘|’ in the signal controller detector record (Evaluating signal controller detector records). |
Displaying the time difference
Thus you can determine, for example, the length of time from a detector call to the release of a signal group.
1. Click the Simulation single step button  .
.
2. Click a time, and keep the mouse button pressed.
3. Click a another time, and keep the mouse button pressed.
At the bottom left of the window, the time difference between these two times is displayed.
Using the Signal times table window
In the window, a signal controller time step is four pixels wide at one call/simulation second. If the controller is updated twice per simulation second, a time step is only two pixels wide, the width is only one pixel if it is updated three times or more.
For a fixed time controller, you enter the number of signal controller time steps per simulation second as a Controller frequency (Defining a signal controller with frequency). For external controllers, see the further information of the documentation on the respective control program.
The label of the time axis indicates the cycle second every ten simulation seconds. In addition, a tick mark indicates each 5 seconds. The time axis remains unchanged when the controller runs with multiple time steps per second.
If the controller DLL or the *.exe file indicate the same simulation second multiple times in succession, only the first simulation second is used for the axis label.
A maximum of 5,000 time steps of the controller can be shown.
