Configuring turn value visualization
1. Make sure that:
- Activate turn value visualization for the node of your choice (Activate turn value visualization).
- For the Nodes evaluation, select Collect data (Evaluating nodes).
- For each node whose turn values you want to visualize, select the Use for evaluation attribute (Attributes of nodes).
- The simulation parameters are set and the simulation can be started (Defining simulation parameters), (Selecting the number of simulation runs and starting simulation).
2. On the network object sidebar, next to Nodes, click the Edit graphic parameters button  (Editing graphic parameters for network objects).
3. Select the option Show turn value visualization.
4. Next to Show turn value visualization, click the  symbol.
The window Edit turn value visualization opens.
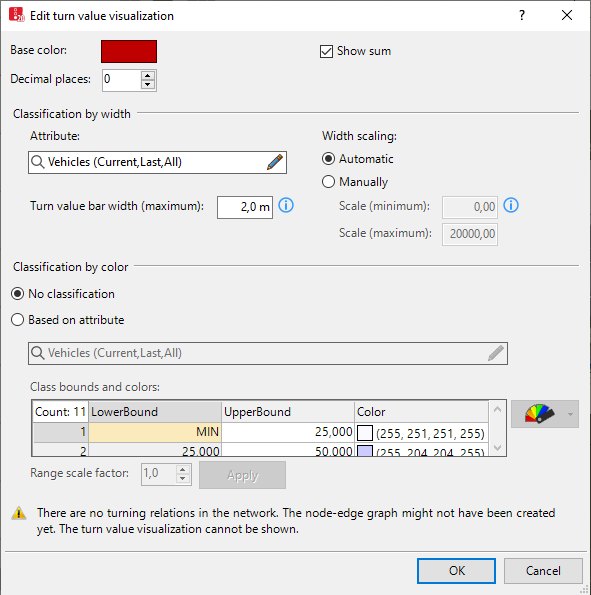
5. Make the desired changes:
| Element | Description |
|---|---|
|
Base color |
Line color of turn relations in the node, if for the node, Show turn value visualization is selected, there are movements, but no values available yet that could be visualized as turn values. This may for instance be the case, if no vehicle in the simulation has reached the end of turn relation yet. |
|
Decimals |
Indicates the numeric attribute values, with the selected number of decimal places. |
|
Show sum |
Displays the total of values of the attribute selected for Classification by width at the beginning and end of each movement. For Vissim to be able to show numeric attribute values and sums, several elements of the program interface must be set large enough (Visualizing turn values). |
|
Classification by width |
Attribute Width scale:
|
|
Classification by color |
Range scale factor:
|

 : The width of turn volumes and the numeric attribute values displayed at the beginning and end of turn volumes are based on the values of the selected attribute as well as on the following settings:
 : Select a pre-defined color scheme that contains class bounds and colors. The color schemes vary in color and class bound:
6. Confirm with OK.
Superordinate topic:
