Editing the graph of a function or distribution
You can edit the values of a distribution in the list of the distribution type concerned. For the following distributions, you can also open a window where you can define or move intermediate points:
- Desired speed
- Power
- Weight
- Location
- Distance
- Time: Only for empirical distributions
- Occupancy: Only for empirical distributions
1. Select the desired distribution from the menu Base Data > Distributions.
The list of distributions of the selected distribution type opens.
2. Select the desired entry.
3. Edit the desired entries.
4. To edit the intermediate points in the distribution curve, double-click the desired distribution.
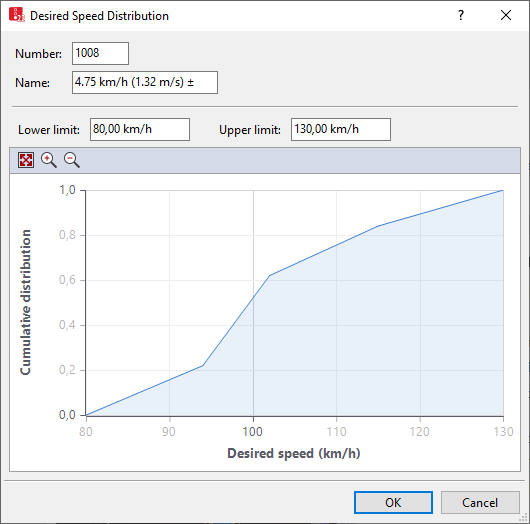
The <Name> Distribution window opens. Example desired speed distribution with three intermediate points in the curve:
5. Make the desired changes:
| Element | Description |
|---|---|
|
Name |
Name of distribution |
|
Left-hand field with unit |
Minimum value |
|
Right-hand field with unit |
Maximum value |
6. To add an intermediate point, on the line, right-click the position of your choice.
7. To change the shape of the curve, click the desired intermediate point, hold the mouse button down and drag the intermediate point to the desired position.
8. Release the mouse button.
Superordinate topic:
Related topics:
Using desired speed distributions
Using location distributions for boarding and alighting passengers in PT
