Grid-based evaluation of pedestrian density and speed
|
|
Note: Grid-based evaluations requires a lot of memory. Make sure that approximately 1 GB of memory space is available. |

You can determine the density and speed of pedestrians based on grid cells. You can also visualize them based on grid cells. It, for instance, allows you to calculate, show and save an average level-of-service image of multiple simulation runs. Density and speed data form the basis of the LOS color scheme (Using LOS schemes for showing aggregated pedestrian values), (Assigning a color to areas based on aggregated parameters (LOS)), (Assigning a color to ramps and stairs based on aggregated parameters (LOS)). In addition, you have the following options to evaluate pedestrian density and speed.
- area-based (Evaluating pedestrian density and speed based on areas).
- for each individual pedestrian In this case, density is based on the pedestrians that at the end of an evaluation interval are located within a radius around a pedestrian (Showing pedestrians in the network in a list).
Density and speed are determined for the following network objects:
- Pedestrian Areas
- Ramps & Stairs
- Links for which the attribute Is pedestrian area has been selected.
By default, the data for all pedestrian classes is entered together. You can also show the data for certain pedestrian classes separately in the evaluation (Configuring evaluations of the result attributes for lists).
Grid cells that are only partially on areas or ramps or are partially occupied by obstacles are not considered walkable ground.
The position of the pedestrian is detected at the end of the time interval, for example in the time interval 5 s to 6 s at 6 s and not already at the beginning at 5.1 s.
You can save the following data and data formats:
| Output | ASCII file | MDB table |
Attribute file from attribute list Area evaluation results or Ramp results |
|---|---|---|---|
|
Aggregated data |
- |
- |
|
|
Raw data |
- |
- |
- |

- Show result attributes in attribute lists (Displaying result attributes in attribute lists)
- Show result attributes in a result list (Showing result attributes in result lists)
1. From the Evaluation menu, choose > Configuration > Result Attributes tab.
2. In the Pedestrian Grid Cells row, select Collect data.
Select the Collect data option to enable the recording of result attributes. If your next steps are to click the More button, open the Pedestrian Grid Cells window and select Only last interval, the data will not be saved and will therefore not be available outside of the simulation run, but only during the simulation run for visualization of the data in a color scheme.
3. If desired, change the time and/or the interval (Configuring evaluations of the result attributes for lists).
4. Click the More button.
The Pedestrian Grid Cells window opens.
5. Make the desired changes:
|
Element |
Description |
|---|---|
| Only last interval |
|
| Cell size |
Edge length of a grid mesh. Value range 0.01 to max [m], default value 1.00 m |
| Range of influence |
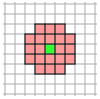
Number of pedestrian-grid cells in each direction (up, down, left, right, diagonal) up until which pedestrians are considered for density measurement. The resulting area created around each pedestrian-grid cell is used by Vissim for the calculation of average LOS. Value range 1 - 5 Example Range of influence = 3
The figure shows the pedestrian grid cells that are taken into account in the density measurement for a grid point when the influence area = 3. All pedestrians in the red cells and the green cell are counted and the number is divided by the content of the accessible area of these cells. The density value is only displayed in the cell highlighted in green. |
| Threshold |
Vissim records for how long the following attributes values exceed the threshold. You can enter a threshold value for each attribute. For each attribute, you can show the duration recorded during the simulation graphically in a color scheme of the area or the ramp. This is also possible for a link, if the attribute Is pedestrian area is selected for it (Assigning a color to areas based on aggregated parameters (LOS)), (Assigning a color to ramps and stairs based on aggregated parameters (LOS)), (Assigning a color to links based on aggregated parameters).
|
| Filter by sections: |
Select the sections for which you want to collect data. If no sections are selected, data is collected for the entire network. Select sections when you want to record and save grid-based evaluations.for large models, small grid cells and many time intervals. Otherwise, if data is then collected for the entire network, your evaluation file will be very large. If a cell is only partly located within a section, the actual area of the cell is used for the calculation of area-based evaluations (density). |
6. Confirm with OK.
7. Configure the visualization of grid-based data (Assigning a color to areas based on aggregated parameters (LOS)) (Assigning a color to ramps and stairs based on aggregated parameters (LOS)).
8. Start the simulation (Running a simulation).
Superordinate topic:
