Creating charts
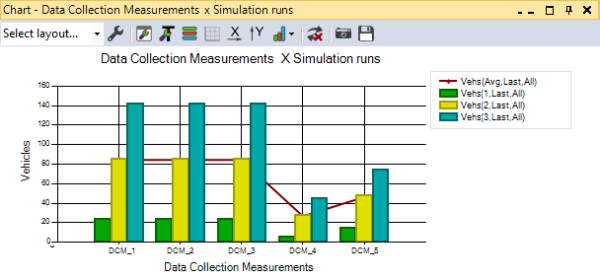
You can show data graphically in charts, which are convenient for comparison, analysis or use in reports or presentations.
In Vissim you can show the following data in bar charts or line charts:
- Data containing the characteristics of your Vissim network, such as base data or attributes of network objects. This includes data from user-defined attributes.
- Data arising from simulations, such as result attributes from result lists

Superordinate topic:
Information on editing:
Creating a chart quick-start guide
Creating charts with or without preselection
Related topics:
