Showing results of queue counters in lists
Queue counters must be defined in the network (Defining queue counters).
by default, the data for all vehicle classes is entered together. You can also show the data for certain vehicle classes separately in the evaluation (Configuring evaluations of the result attributes for lists).
You can save the following data and data formats:
| Output | ASCII file | MDB file |
Attribute file from attribute list |
|---|---|---|---|
|
Aggregated data |
- |
- |

|
|
Raw data |
- |
- |
- |
- Show result attributes in attribute lists (Displaying result attributes in attribute lists)
- Show result attributes in a result list (Showing result attributes in result lists)

|
Tip: You can also visualize queue lengths in the network editor (Graphic parameters for visualizing of queue lengths). |
1. From the Evaluation menu, choose > Configuration > Result Attributes tab.
2. In the Queue counters row, select the option Collect data.
3. If desired, change the time and interval (Configuring evaluations of the result attributes for lists).
4. Click the More button.
The Queue counters window opens.
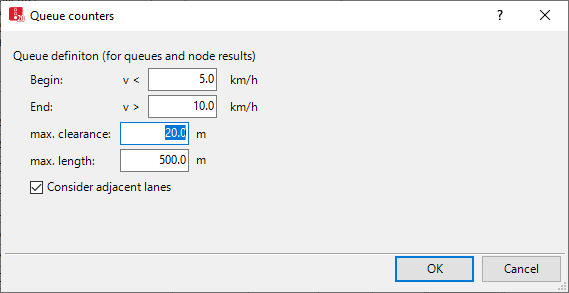
5. Define the settings for the desired output.
| Element | Description |
|---|---|
|
Begin |
Define queue condition: A vehicle is in queue if its speed is less than the value v < that was entered for the Begin. |
|
End |
A vehicle remains in queue as long as its speed has not yet exceeded the value v > that was entered for the End. |
|
max. clearance |
Maximum net distance which can occur between two vehicles in queue. The queue is considered to be interrupted if there are larger gaps. Values between 10 and 20m are usual. |
|
max. length |
Maximum queue length. Longer queues may still occur. This attribute is useful if longer queues occur at the next node in the network, but the queues are to be evaluated separately for each junction. When a large value, for example, 4 km, allows a long queue to form, the simulation speed decreases. |
|
Consider adjacent lanes |
|
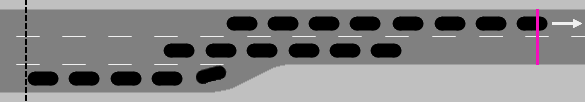
 If this option is not selected, the adjacent lanes of the previous link are not taken into account for calculation of the queue end. In the figure, the dashed line indicates the position of the queue end:
6. Confirm with OK.
7. Start the simulation (Running a simulation).
8. If you wish, choose in the Evaluation menu Result Lists > Queue Results.
Result of the evaluation of queue counters
| Column | Description |
|---|---|
|
QLen |
Maximum distance between the traffic counter and the vehicle that meets the queue conditions defined. The queue length is specified as average queue length: With each time step, the current queue length is measured upstream by the queue counter and the arithmetic mean is thus calculated per time interval. This also includes zero values, if there is no vehicle that meets the queue condition. The queue length is the maximum distance between the traffic counter and the vehicle that meets the queue conditions defined. |
|
QLenMax |
Queue length (maximum): In each time step, the current queue length is measured upstream by the queue counter and the maximum is thus calculated per time interval. |
|
QStops |
Number of queue stops. A queue stop is where one vehicle that is directly upstream or within the queue length falls below the speed of the Begin attribute defined for the queue condition. |
Superordinate topic:
Related topics:
Comparing evaluations of PTV Vissim and evaluations according to HBS
Performing environmental impact assessments
Showing results of measurements
Configuring evaluations of the result attributes for lists
Configuring evaluations for direct output
Showing evaluations in windows
Importing text file in a database after the simulation
Output options and results of individual evaluations
Visualizing evaluation results
Defining and generating measurements or editing allocated objects
Displaying OD pair data in lists
Evaluating pedestrian density and speed based on areas
Output attributes of area and ramp evaluation
Evaluating pedestrian areas with area measurements
Evaluating pedestrian travel time measurements
Saving pedestrian travel time measurements from OD data to a file
Saving pedestrian record to a file or database
Saving vehicle record to a file or database
Saving lane change data to a file
Grid-based evaluation of pedestrian density and speed
Saving discharge record to a file
Showing meso lane results in lists
Showing meso edges results in lists
Saving data about the convergence of the dynamic assignment to a file
Evaluating SC detector records
Saving SC green time distribution to a file
Saving managed lane data to a file
Vehicle network performance : Displaying network performance results (vehicles) in result lists
Pedestrian network performance: Displaying network performance results (pedestrians) in lists
Saving PT waiting time data to a file
Evaluating data collection measurements
Evaluating vehicle travel time measurements
Showing data from links in lists
Showing delay measurements in lists