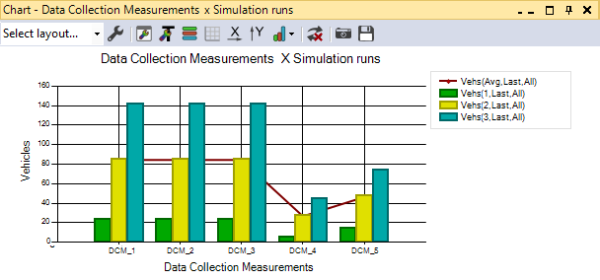
You can show data graphically in charts, which are convenient for comparison, analysis or use in reports or presentations.
In Vissim you can show the following data in bar charts or line charts:

Information on editing:
Creating a chart quick-start guide
Creating charts with or without preselection
Related topics:
