Comparison bars are used to visualize differences between two attribute values. The difference is displayed as a bar, making it easy to recognize deviations. You can display the absolute difference in value or the relative change between two attributes. The width of the bar indicates the difference of the two attribute values.
For links and connectors, the bars show the difference between two attributes, for flow bundles the difference between two attributes of the OD pair and for turn volumes the difference between two turn attributes.
For links and connectors, you can display the difference between two attributes of a network object by a single bar. With flow bundle volumes, you can display the difference between two attributes of an OD pair accordingly by one bar. With turn volumes, you can display the difference between two turn attributes by one bar.
The width of the bar indicates the difference of the two attribute values. Via the classification settings, you can classify the differences. Additionally, the classes can be distinguished by color.
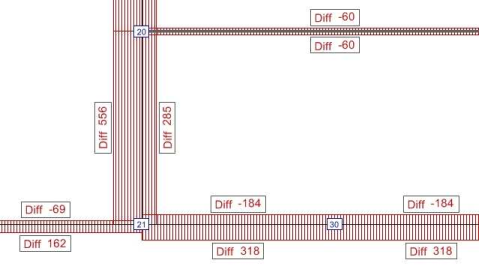
- Example of a uniform display of difference values
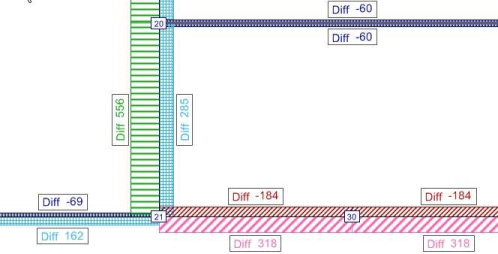
- Example of a classified display of difference values
1. Make sure that the appropriate page has been opened in the Edit graphic parameters window:
- Links: Links > Bars > Display
- Connectors: Connectors > Bars > Display
- Desire lines for zones: Desire lines zones > Display
- Desire lines for main zones: Desire lines main zones > Display
2. If required, add another column for a bar (Defining one or multiple bars).
3. Click in the header of the column for the desired bar.
|
Note: You can directly edit some of the display properties in the column. The Edit function provides access to all display properties. |
4. Click the  Edit icon.
The Edit bar <no> window opens.
5. Select the Draw this bar option.
6. In the Bar type section, select the option Difference bar.
7. In the Bar type section, select the option Comparison bar.
8. Select the Scaling tab.
9. Select the Width tab.
10. Select the attributes you want to compare.
11. In the Scaling attribute section, make the desired settings.
|
Element |
Description |
|
Plus sign |
Via this button, you select the first attribute of the network object type. |
|
Minus sign |
Via this button, you select the second attribute of the network object type. |
|
Note:
|
|
Note: Click the |
 symbol to swap the selected attributes.
12. Select the desired Comparison type:
|
Element |
Description |
|
Absolute difference |
If this option is selected, the comparison bar shows the absolute difference between the current value and the reference value. Formula: Current value - reference value. |
| Relative change |
If this option is selected, the comparison bar shows the relative change as a ratio of the values of the selected attributes. Formula: Current value / reference value - 1. |
13. Adjust further settings (Setting the display properties of a standard bar).
14. Click the Preview button.
In the Network editor window, the values are shown as bars according to your settings.
