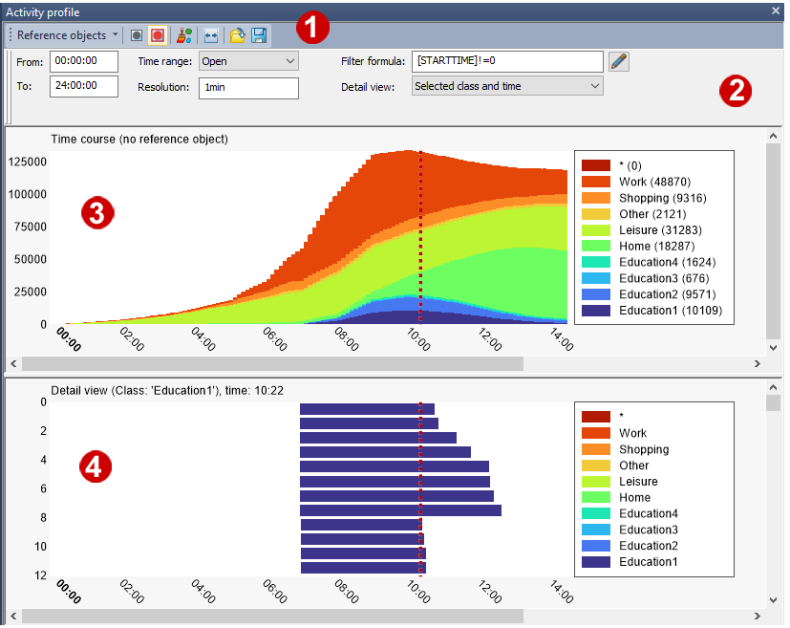
The profile view is divided into a Temporal distribution section and a Detail view.
You can zoom both views independently of each other with the mouse wheel if you point the mouse in the area of the X and Y axis.
With the mouse, you can move the vertical marking line to the desired point in time.
(1) Toolbar
The toolbar allows you to call specific program functions (Specifying settings for profiles).
(2) Filters and settings
In this area, you can enter a filter formula and make further settings for the display (Specifying settings for profiles).
(3) Temporal distribution
The temporal distribution represents a set of network objects of the selected type over time. Each object forms a strip from its start to its end time in the timeline. Temporally overlapping elements are displayed one above the other. Elements without a start time are not displayed.
You can classify the display using an attribute (Setting graphic parameters for profiles). The example shows a classified display, i.e. each class is displayed differently. A legend shows the individual classes and in brackets the number of objects per class at the selected time.
(4) Detail view
The associated activities of the class selected (or class and time) in the temporal distribution section are displayed in the detail view, with a legend next to them.
|
Note: The detail view can be synchronized with the network editor and all other windows via the icon |
 , so that the same element is highlighted in all windows when selected.
