Example network for PuT assignment procedures

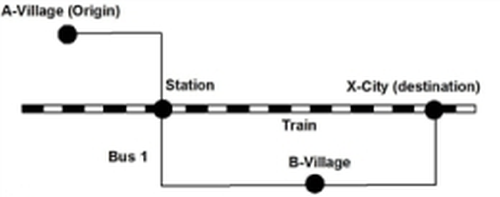
The different procedures are described below using an example (Illustration 152, Illustration 153, Illustration 154, Table 159 and Table 160). Find the connections between A-Village and X-City on the basis of the example's PuT supply.

The following assumptions apply.

  • The calendar is not used.
  • Access and egress times are not considered, that is, they are set to 0 minutes.
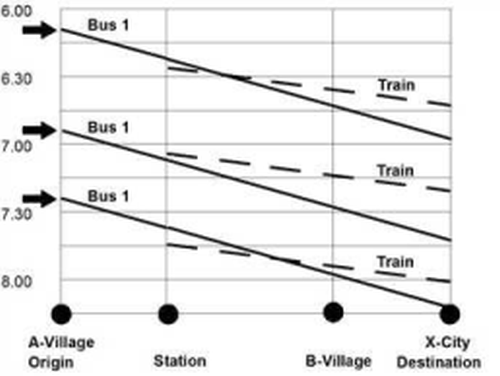
  • The analyzed time interval starts at 5:30 a.m. and ends at 7:30 a.m.
  • Travel demand between A-Village and X-City amounts to 90 trips (Tables $MATRIX and $MATRIXSINGLELISTITEM in demand data file PuT.dmd).
  • 33% of travel demand, that is 30 trips occur between 5:30 a.m. and 6:30 a.m., the remaining 67 % or 60 trips are distributed across the period between 6:30 a.m. and 7:30 a.m. (Tables $TIMESERIES and $TIMESERIESITEM in demand data file PuT.dmd).

The Table 159 contains example data of the PuT.dmd file which is provided in English.


Table 159: Demand matrix and temporal distribution of demand for the example

$VISION
* VisumInst
* 04/11/07
* 
* Table: VERSION
$VERSION:VERSNR;FILETYPE;LANGUAGE;UNIT
4,000;Demand;ENG;KM
* Table: ODMATRIX
$ODMATRIX:NO;CODE;NAME;CONTENT;ROUND;NUMDECPLACES
1;C;Car;;0;0
2;H;HVeh;;0;0
3;P;PuT;;0;0
* Table: MATRIXSINGLELISTITEM
$MATRIXSINGLELISTITEM:MATRIXNO;FROMZONENO;TOZONENO;VALUE
1;100;200;2000.000
2;100;200;200.000
3;100;200;90.000
* Table: TIMESERIESDOMAINTYPE
$TIMESERIESDOMAINTYPE:NO;DESCRIPTION;UNITYSTRING;NUMDECPLACES;MAXVALUE;MINVALUE
1;Time series by percentages;%;2;9999999999.000;0.000
2;Time series of matrix numbers;No;0;999999999.000;0.000
* Table: Time series
$TIMESERIES:NO;NAME;TYPENO;UNITX;NUMINTERVALS;LENGTHINTERVAL;USEVALUELIST;VALUELISTTYPE; VALUEREFTYPE;DECSEPARATOR;VALUESEPARATOR
1;;1;;86400;1;0;0;2;;
* Table: Time series items
$TIMESERIESITEM:TIMESERIESNO;STARTINTERVALINDEX;ENDINTERVALINDEX;VALUE
1;1;19800;0,000
1;19801;23400;33.000
1;23401;27000;67.000
* Table: Demand time series
$DEMANDTIMESERIES:NO;CODE;NAME;TIMESERIESNO
1;;;1
* Table: Demand descriptions
$DEMANDDESCRIPTION:DSEGCODE;DEMANDTIMESERIESNO;MATRIXNO;STARTDAYINDEX;STARTTIME
C;0;1;1;12:00 AM:00
H;0;2;1;12:00 AM:00
P;1;3;1;12:00 AM:00

The example network is saved to the directory ...\Users\Public\Public documents\PTV Vision\PTV Visum 2024\Example_net.

  • Version file: Example.ver
  • Graphic parameters PuT.gpa
  • Demand matrix and demand distribution PuT.dmd
  • Procedure parameters PuT.xml

Illustration 152: Timetable

Illustration 153: Line map


Table 160: PuT supply of the example with connections from A Village to X City

Timetable Bus 1

Timetable Train

A Village

6:10

6:55 AM

7:25 AM

Station

6:25 AM

7:05 AM

7:45 AM

Station

6:22 AM

7:07 AM

7:37 AM

X City

6:41 AM

7:21 AM

8:01 AM

B Village

6:42 AM

7:27 AM

7:57 AM


X City

6:55 AM

7:40 AM

8:10 AM


Connections

Departure 6:10 a.m., arrival 6:55 a.m., ride time 45 min., 0 transfer

Departure 6:10 a.m., arrival 6:41 a.m., ride time 31 min., 1 transfer

Departure 6:55 a.m., arrival 7:40 a.m., ride time 45 min., 0 transfer

Departure 7:25 a.m., arrival 8:10 a.m., ride time 45 min., 0 transfer

Departure 7:25 a.m., arrival 8:01 a.m., ride time 36 min., 1 transfer