1. On the Graphics menu, click Edit graphic parameters.
The Edit graphic parameters window opens.
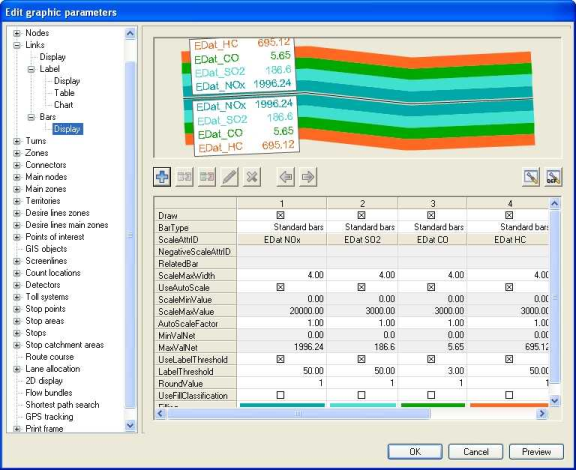
2. In the navigator, select the entry Links > Bars.
3. Make the basic settings (Displaying bars and adjusting basic settings).
4. Insert the desired bars (Defining one or multiple bars).
5. Specify the desired bar settings (Setting the display properties of a standard bar).
6. In the Scaling attribute section, select one of the following attributes for each bar, via the button:
- EDat-CO (carbon monoxide in kg/km)
- EDat-HC (Hydrocarbons in g/km)
- EDat-NOx (Nitric oxides in g/km)
- EDat-SO2 (Sulphur dioxide in g/km)
7. Confirm with OK.
The bars are displayed according to your chosen settings.
