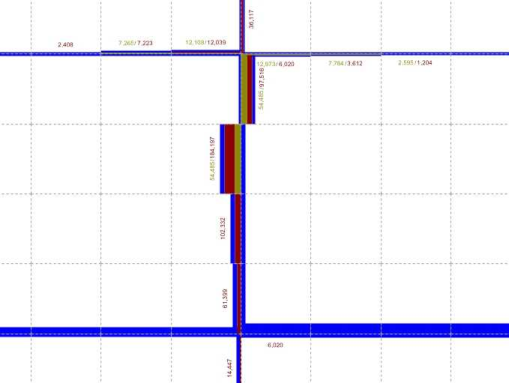
Based on the link attributes calculated, you can e.g. show your emission results as link bars.
|
Note: We recommend scaling the emission values for the display of link bars to achieve better results. To do this, use the Edit attribute operation and divide by the length and, if necessary, the volume, too. Alternatively, you can display absolute values in the form of column charts. |
1. On the Graphics menu, click Edit graphic parameters.
The Edit graphic parameters window opens.
2. In the navigator, select the entry Links > Bars.
3. Make the basic settings (Displaying bars and adjusting basic settings).
4. Insert the desired bars (Defining one or multiple bars).
5. Specify the desired bar settings (Setting the display properties of a standard bar).
6. In the Scaling attribute row, for each bar, click the button to select the desired emission value.
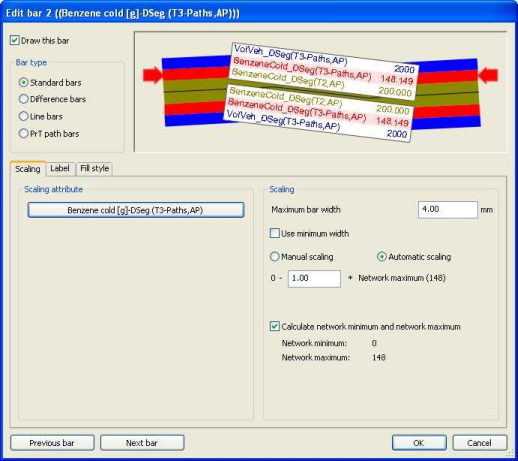
7. Confirm with OK.
In the network, the selected emission values are displayed on link level.