The 3-D network view allows you to project data saved in the network model into the third dimension. This enables you to present model results in an impressive and vivid way (User Manual: Using the 3-D network view). The changed perspective shows the most interesting characteristics of a large area at a glance. The 3-D network view is a mere visualization tool. It does not allow you to edit the network displayed.
You can move the 3-D network view with the mouse to look at an area from different viewing positions and perspectives. You can also use different zoom levels. The perspectives can saved as camera positions and selected via their name.
For orientation in the 3-D network view, you can show a 2-D network view as a basic map. Thereby you can choose between graphic parameters of the 2-D network editor or separate graphic parameters. You may also use background maps and aerial images. The basic map is always flat. A 3-dimensional display of the landscape topography or a terrain model are not provided.
You can open multiple 3-D network views and use them independently from each other. The views can then be synchronized via the specified camera positions. The actual 3-dimensional display of model data is enabled via several different display types. Each of them is suitable for a different object type and focuses on different aspects.
3-D prism displays
In 3-D prism displays of planar objects (zones, territories, POIs, …) the polygon contours are extruded vertically to create prism-shaped objects. The height of the prisms is scaled via any numeric attribute values. Conventional graphic parameters can be used to display the prisms.
In addition, a special display mode is available that shows the prisms in differently colored height bands, which allow for a rough optical comparison of the values.

Image 265: Prism representation in height bands of values
3-D bar display
Using the 3-D bar display you can show link attributes as 3-dimensional bars. To show the complete assignment results and avoid any gaps, main turn and connector data is included. As for the 3-D prism display, hypsometric coloring is available. In addition to statistical data, you can also use the 3-D bar display to show attributes with a reference to analysis time intervals. The 3-D network view is then linked to time interval control, which allows you to model developments over time in an animated simulation.
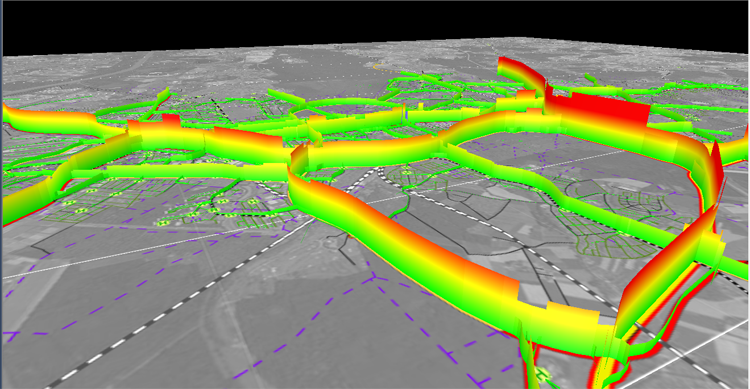
Image 266: Bar display in height bands of values
Storyboards and recording
The representation of a sequence of multiple camera positions can be saved to a so-called storyboard. Switching between two camera positions can be done dynamically as needed, so that orientation in the network is ensured and the data can be presented in a useful way. The recording of such a storyboard as a film allows for a high-quality representation of the 3-D network view, even without using Visum. It does not require a computer with a powerful graphics card.
|
Note: In the directory C:\Users\Public\Documents\PTV Vision\PTV Visum 2022/Examples, you can find an example of use on this topic. The 3D Visualization example shows the options available for displaying model data in the 3-D network view and how to use images to record videos. |
