In the graphical timetable, vehicle journeys or vehicle journey sections are depicted in a space-time diagram. You can align the diagram horizontally or vertically. It provides you with a clear overview of connections for different types of vehicle journeys, passenger trip chains, forced chainings and conflicts of infrastructure use. The options available for formatting various elements and bars of vehicle journey item attributes allow you to perform additional analyses and generate informative views. In Image 275, the stroke display is classified according to lines (User Manual: Specifying basic settings for the Network editor window), to distinguish vehicle journeys of different lines by using different colors.
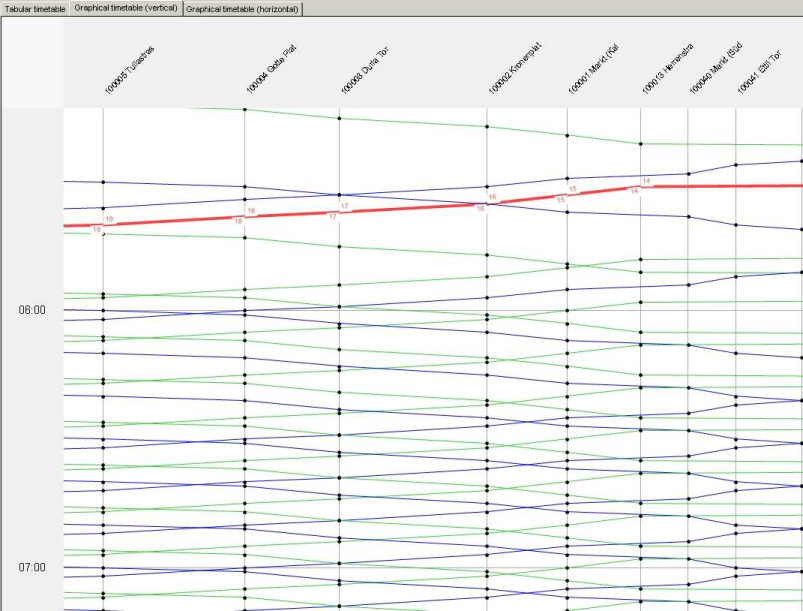
Image 275: Graphical timetable with classified display of vehicle journeys as lines
Item bars, which can be scaled with direct and indirect vehicle journey or vehicle journey section attributes, can be drawn for vehicle journeys and vehicle journey sections (User Manual: Specifying basic settings for the Network editor window).
Item bars can also be classified (User Manual: Specifying basic settings for the Network editor window). In Image 276 classification is carried out with the vehicle journey volume.
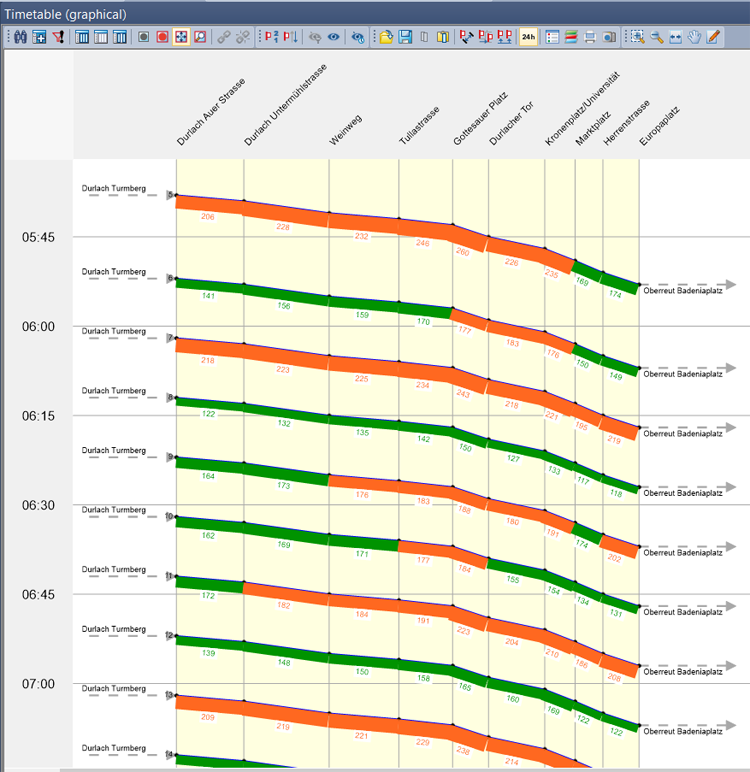
Image 276: Classification of item bars with the vehicle journey volume
Visum offers the possibility of displaying multiple bars with different attributes on vehicle journeys or vehicle journey sections (User Manual: Specifying basic settings for the Network editor window). The Image 277 displays bars for Boarding passengers, Alighting passengers and Through passengers.

Image 277: Display of item bars for boarding passengers, through passengers and alighting passengers
Using the classified display of city line stops allows you to highlight final line stops or other important stops. You can also color areas between city lines, e.g. to highlight single-track railways. This is done by using aggregated attributes of network objects traversed by the line routes. Crossing trips within such a section can be displayed as conflicts (Image 278).
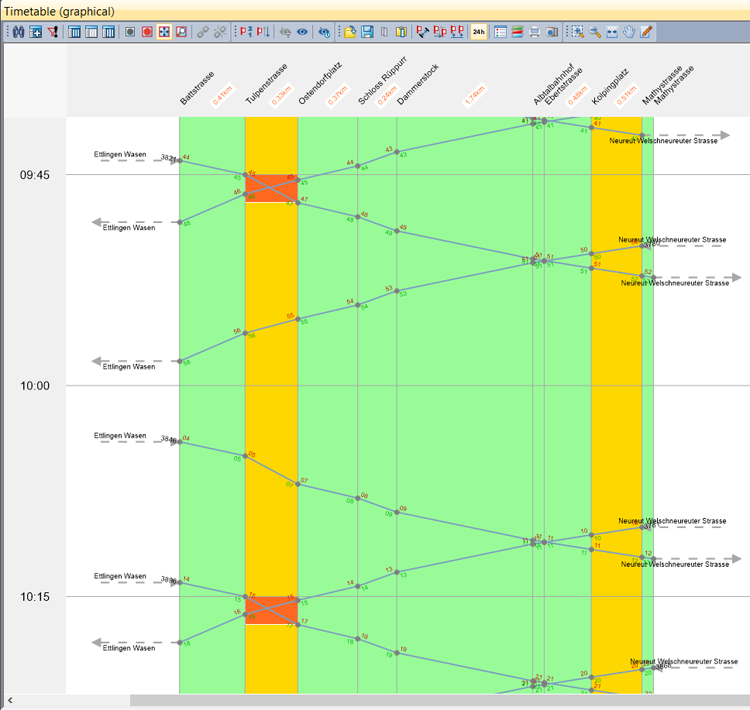
Image 278: Classified display of background based on network attributes, and marking of conflicts
