With the signal time-space diagram (User Manual: Displaying signal time-space diagrams), you can display the signal times of signal controllers along a path (Paths) in a time-distance diagram and manually adjust and optimize the offset between the signal controllers. Optionally, green bands can also be displayed for a second path in opposite direction. The green bands start at the green times of the upstream signal controllers and extend in driving direction to the next signal controller. The gradient is determined based on the travel time that is calculated according to the parameters set for signal offset optimization (User Manual: Signal offset optimization) . You can choose between two different display modes for the signal space-time diagram. In the "Flowing off" mode, the green bands are drawn as parallelograms whose width corresponds to the entire green time of the upstream signal controller. In the "Arterial bands" mode, the green band with the maximum width is determined which leads through the green stages of all signal controllers of the signal time-space diagram ("progressive signal system"). If such a green band cannot be found, no signal time-space diagram will be drawn.
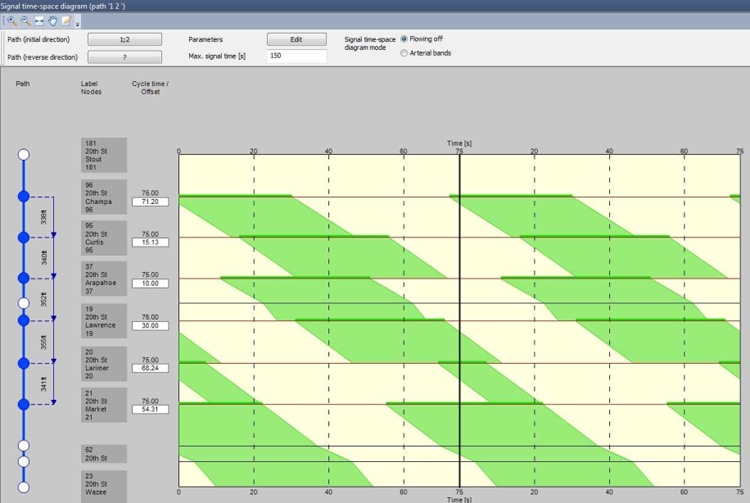
Image 267: Signal time-space diagram in mode "Flowing off"
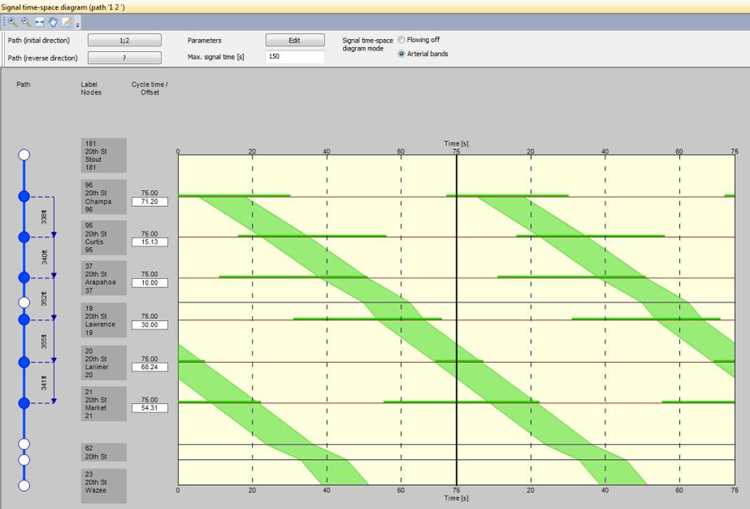
Image 268: Signal time-space diagram in mode "Arterial bands"
The offset of the signal controllers can be edited directly in the diagram in order to synchronize the green bands.
A user-defined PrT path which shall be used for the opposite direction, must have at least two nodes in common with the path of the first direction and all intermediate nodes must be traversed in reverse order. This requirement permits the use of two separate paths for the display and thus, for example, the consideration of lanes divided by direction.
