To visualize the node topoloty in the network editor (Junction modeling), you can graphically display the lane allocation at nodes (User Manual: Displaying lane allocations in the Network editor window). A rectangle is then drawn for each outgoing link of a node, which is open for one or more PrT transport systems and which has one or more lanes. Inside the rectangle, an arrow is drawn for each approach lane and an arrow head for each permitted lane turn. The Image 263 shows an example of a node with four legs.
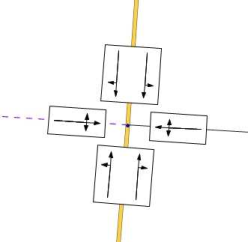
Image 263: Lane allocation in the network display
A classified display is also possible for the lane allocations, by direct and indirect node attributes. This is how you can export the lane allocation in different colors, depending on the node volume. The Image 264 demonstrates this with an example of a roundabout.
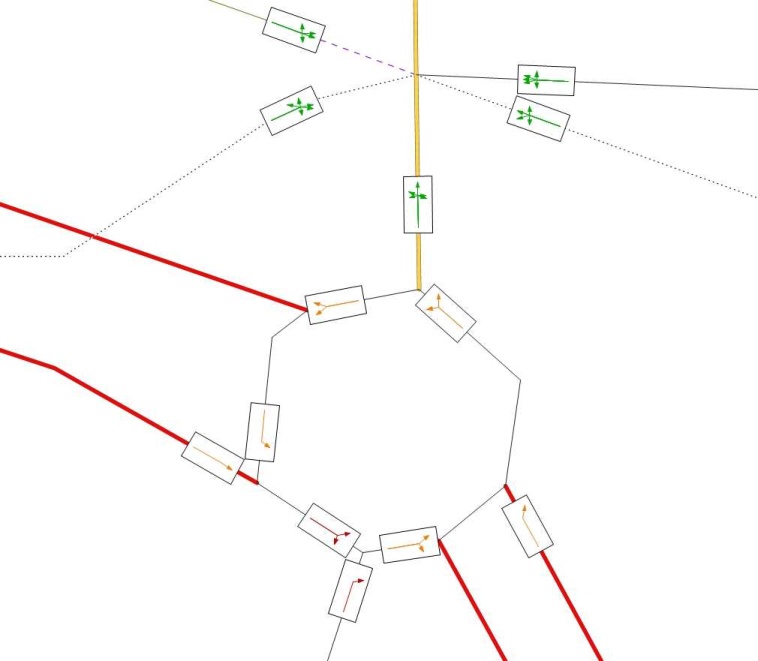
Image 264: Classified lane allocation according to the node volume
