As all matrix correction procedures, the procedures in Visum are meant to adjust a demand matrix, so that its assignment results for a supply actually match the real supply observed (source/target traffic, passenger trips unlinked or number of boarding/alighting passengers). Matrix correction can be useful in several situations:
- A demand matrix based on empirical survey data is outdated and you want to update it without having to conduct a new (origin-destination) survey. The update shall be based on based on census data only.
- A matrix generated from the transport network model is to be calibrated, therefore counted volume data is to be used.
- A matrix generated from incomplete or not reliable data is to be improved by more comprehensive/reliable volume data counted simultaneously.
- A survey contains the journey distance distribution, but the model does not reflect the data with the level of accuracy required.
The matrix correction procedure solves this problem for PuT as well as for PrT. In the dynamic variant, the "least squares" method corrects a matrix time series with reference to the volume per analysis time interval. For all other procedures, it is the static matrix that is corrected and the correction always refers to the total volumes.
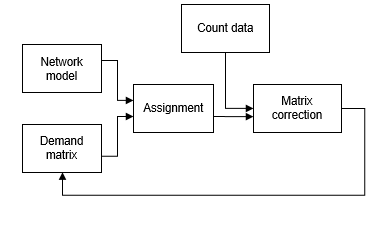
The flow of information always follows the given order.

The workflow for the matrix calibration is as follows.
You can choose the following count data:
- Link volumes
- Origin/destination travel demand per zone
- Volumes of turns at nodes and main turns at main nodes (as long as they are defined)
- Volumes via screen lines
- Volumes on lanes
- PuT passenger trips unlinked per line
- PuT passenger kilometers per line
- Boarding/alighting passengers at stop areas
- Skim data distribution, e.g. journey distance distribution
You can also combine count data.
You can find a detailed description of how to use journey distance distribution in the Examples directory:
\Users\Public\Public Documents\PTV Vision\PTV Visum 2022\Examples\Matrix TFlowFuzzy\TFF_Distribution
|
Tip: Alternatively, open the folder via the menu Help > Examples > Open Examples directory > Examples > Matrix TFlowFuzzy > TFF_Distribution. |
It is best to work with volumes on lanes if you want to use count data that comes from stop line detectors. These are - other than manually collected node flows - not already assigned to a (main) turn, but to the lane the detector is located on. If you are using lane counts, you need to model the lane allocation at the respective node in the Junction editor. Visum aggregates lane counts to counts per lane group, i.e. the count data is added across all (main) turns that have at least one shared lane. The matrix correction procedure compares the count data sums to the volumes of all routes that use this lane group.
Sometimes PuT passengers alighting/boarding at stop areas are counted separately for each direction. To be able to use the information content of the disaggregated count data, without having to separate the stop area into several parts, separate the line routes traversing the stop area into groups. Then specify count data and tolerances or weights for each group.
If a journey distance distribution (or a distribution in general) is given, you should take care that the shares per interval do not become too small, since this would severely restrict the solution space and thus possibly prevent a good solution. It has proven useful to choose a rather logarithmic subdivision, e.g. the interval limits 1, 2, 5, 10, 20, 50.
For the update, the specified count values are compared with the volumes, which result from a pre-calculated assignment of the previous demand matrix. Differences between count values and volumes are balanced by adjustment of the demand matrix for the assigned demand segment. The simplest case refers to a single demand segment. The volumes from the selected network object are then taken from the assignment result of this demand result, and the count values also only refer to this demand segment. Both TFlowFuzzy and the least squares method can also simultaneously update the demand matrices of several demand segments if only total count values are specified for all demand segments. Then the count data specified is distributed proportionally to the respective demand segment share of the assignment volumes. The demand matrix for each demand segment is then updated individually.
The demand calculation procedures implemented in Visum are characterized by the following properties:
- that you can combine the following for matrix correction: origin/destination traffic, link volumes, turns, main turns or screen lines, passenger trips unlinked and passengers boarding/alighting at stop areas and distributions (e.g. journey distance).
- Count values do not have to be available for all network objects.
- The statistical uncertainty of the count figures can be modeled explicitly.
- You can specify that the distribution of the result matrix must correspond to the distribution of an existing demand matrix.
- You can use count data that only covers part of the PuT lines. In this case, only volumes or boarding/alighting passengers that refer to active line route elements are taken into account for calculation.
