Link costs are infrastructure costs, which accumulate when using a link. The link costs are divided equally between the vehicle journeys which use the link. Up to three cost values (attributes CostRate1_PuTSys - CostRate3_PuTSys) can be specified per link and transport system to model link costs (User Manual: Properties and options of links). For each of these three cost values, one of the following cost types can be selected:
- Depreciation costs, for example annual costs for depreciation and interest rates which result from the investment cost for the link
- Running costs, for example maintenance costs and operating costs
- Utilization costs, for example fees for using stop points or tracks
Dependent on the selected cost type, the allocation of the costs to the individual vehicle journeys is then carried out according to the formulas described below.
|
Cost type depreciation costs |
|
|
CostValue: for example investment costs for a link (link attributes CostRate1-PuTSys, also 2 and-3)
|
|
|
Cost type running costs |
|
|
CostValue: for example annual maintenance costs for a link (link attributes CostRate1-PuTSys, also 2 and-3)
|
|
|
Cost type utilization costs |
|
|
CostValue: for example fees for using a link (link attributes CostRate1-PuTSys, also 2 and-3) CostsLinkV, L, T = CostValueL, T |
|
|
CostValueL, T |
Cost value which is entered as attribute of the link. For running costs the value can refer to AP or AH. Depreciation costs and utilization costs can either be distributed to all vehicle journeys or allocated only to vehicle journeys which end or start at this stop point (User Manual: PuT operating indicators: Infrastructure cost tab). |
|
CostsLinkAP, L, T |
Link costs of the link in the analysis period (AP) |
|
CostsLinkV, L, T |
Costs for a vehicle journey V which uses the link |
|
∑VL, T |
Number of vehicle journeys of transport system T which use link L. |
|
FacTS |
The transport supply projection factor from AP to AH (User Manual: Properties and options of valid days) |
|
DT |
Depreciation time in years |
|
p |
Interest rate [%] |
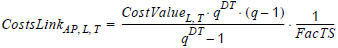 with q = 1 + p/100
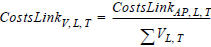

Calculation example: Link costs for vehicle journeys in the analysis period
|
Cost rate 2 PuTSys(Train) |
100000 CU |
|
Interest rate p |
7 % |
|
Depreciation time DT |
10 years |
|
Projection factor transport supply (FacTS) |
365 |
|
Number of vehicle journeys of the transport system train |
19 |
|
Link Cost 2 of link 4 CostsLinkAP, L, T |
|
|
Link Cost 2 of vehicle journey 58 |
39.008 / 19 = 2.053 |

- Example for running costs
|
Cost rate 3 PuTSys(Bus) |
100 CU |
|
Links traversed by vehicle journey 96 |
1 -> 2 -> 3 -> 5 -> 6 -> 7 |
|
Link lengths |
5 km per link |
|
Length reference of cost rate 3 |
Link length |
|
Time reference of cost rate 3 |
Analysis horizon |
|
Projection factor transport supply (FacTS) |
365 |
|
Link Cost 2 for share of links 1, 2, 3 and 5 |
4 • (20 CU / (19 • 365)) = 0.01154 CU |
|
Link Cost 2 for share of links 6 and 7 |
2 • (20 CU / (38 • 365)) = 0.00288 CU |
|
Link Cost 2 for vehicle journey 96 |
0.01154 + 0.00288 = 0.01442 CU |
- Example for utilization costs (in the example, stored in attribute Link Cost 1)
|
Cost rate 1 PuTSys(Train) |
100 CU |
|
Length of link 4 |
10 km |
|
Length reference of cost rate 1 |
km |
|
Link Cost 1 for vehicle journey (in this example, it is constant for all vehicle journeys of the train) |
100 CU/km • 10km = 1000 CU |
