The indicators of the network performance result from the PuT line use by passengers. For the calculation of the indicators, the volumes have to be available from the PuT assignment. Some of the indicators are automatically calculated during assignment (see overview table IndicatorSource.xls in the directory ...\Program Files\PTV Vision\PTV Visum 2022\Doc\Eng). If the vollume attributes filter is activated, the volumes and thus the transport performance indicators are based on the active OD pairs and/or the active vehicle journey sections (User Manual: Applying the volume attributes filter). The distribution of the volumes to the vehicle journey sections is carried out according to the settings in the general procedure settings in menu Calculate > General procedure settings > PuT settings > page Volumes.
|
Indicator |
Description |
|
Passenger kilometers (DSeg) |
The link that passengers are driving with the PuT vehicle Passenger kilometers = Passenger trips unlinked • trip distance from Boarding to Alighting stop |
|
Passenger hours (DSeg) |
Time which the passengers spend in the PuT vehicle Passenger hours = Volume • Duration |
|
Passenger trips TSys (-DSeg) |
Repeated boarding the same transport system is not counted more than once (for example transferring from one bus into another). |
|
Passenger trips Unlinked / Passenger trips Unlinked PuT |
Line trips correspond to the number of passengers boarding per object (line, route, operator, etc.). Counts each passenger using at least one line route item in the territory. A passenger is not counted if he has already used a vehicle journey of the same object on an earlier path leg. No passengers are counted for path legs that end exactly at the start or start exactly at the end of a time interval. |
|
PTripsUnlinked PuT_Dseg |
Passenger trips per object additionally differentiated by demand segments. This attribute is only available for zones. |
|
PTrips Unlinked >2xTransfer (DSeg) |
Passenger trips with more than two transfers on the path from the origin zone to the destination zone. This attribute is only available for elements of line hierarchy. |
|
PTrips Unlinked with 0xTransfer (DSeg) |
Passenger trips with no transfers on the path from the origin zone to the destination zone. This attribute is only available for elements of line hierarchy. |
|
PTrips Unlinked with 1xTransfer (DSeg) |
Passenger trips with precisely one transfer on the path from the origin zone to the destination zone. This attribute is only available for elements of line hierarchy. |
|
PTrips Unlinked with 2xTrans (DSeg) |
Passenger trips with precisely two transfers on the path from the origin zone to the destination zone. This attribute is only available for elements of line hierarchy. |
|
PTripsUnlinked Total_Dseg |
Passenger trips per object additionally differentiated by demand segments. This attribute is only available for elements of line hierarchy. |
|
Mean volume per trip |
Mean volume per trip = passenger kilometers / service kilometers |
|
Mean volume to seat capacity ratio |
Mean volume to seat capacity ratio = passenger kilometers / seat kilometers • 100 This attribute is only available for elements of line hierarchy. |
|
Volume seat capacity ratio |
Volume seat capacity ratio = volume / seat capacity • 100 always starting from the journey item. This attribute is only available for elements of line hierarchy. |
|
Mean vol/cap ratio total |
Mean volume total capacity ratio = passenger kilometers / total capacity kilometers • 100 This attribute is only available for elements of line hierarchy. |
|
Total vol/cap ratio |
Total volume capacity ratio = volume / total capacity • 100 always starting from the journey item. This attribute is only available for elements of line hierarchy. |
|
Total vol/cap ratio PuT |
Volume capacity ratio PuT total = volume / total capacity • 100 This attribute is only available for elements of a link. |
|
Boarding passengers (DSeg) |
Number of boarding passengers. Boarding passengers = Origin boardings + Direct transfers + Transfers Walk-Board This attribute is available at the line hierarchy, at the stop, at the stop point, and at the levels of the stop point analysis. |
|
Alighting passengers (DSeg) |
Number of alighting passengers. Alighting passengers = Destination alightings + Direct transfers + Passengers transferring alight-walk This attribute is available at the line hierarchy, at the stop, at the stop point, and at the levels of the stop point analysis. |
|
PassOrigin (DSeg) |
Number of boarding passengers that have this stop as their origin. So passengers who transfer here are not counted. This attribute is only available at the stop, at the stop point, and at the levels of the stop point analysis. |
|
PassDestination (DSeg) |
Number of alighting passengers that have this stop as their destination. So passengers who transfer here are not counted. This attribute is only available at the stop, at the stop point, and at the levels of the stop point analysis. |
|
PassThrough |
Number of passing passengers. These are all passengers traveling with a line that traverses this item of a line route / time profile / vehicle journey, but they neither board nor alight here. This attribute is available only at the line hierarchy and at the levels of the stop point analysis. |
|
PassThrough with stop (DSeg) |
Number of passengers with a stop event. This includes all passengers using a line that stops at this stop point, but none of the passengers boards or alights there. This attribute is available only at the stop, the stop point and at the levels of the stop point analysis. |
|
PassThrough without stop (DSeg) |
Number of through passengers without a stop event. This includes all passengers using a line that traverses the stop point, but does not stop there. This attribute is only available for stops and stop points. |
|
PassTransfer |
Number of passenger transfers in the territory This attribute is only available for territories. |
|
PassTransTotal (DSeg) |
Total number of passengers transferring at this stop or stop point PassTransfer= passenger transfers directly + passenger transfers walk-board + passenger transfers alight-walk This attribute is only available for stops and stop points. |
|
PassTransAlightWalk (DSeg) |
Number of passengers alighting at this stop or stop point and walking to another stop or stop point for transfer This attribute is only available for stops and stop points. |
|
PassTransDir (DSeg) |
Number of passengers transferring to another line at this stop or stop point. (This attribute is only available for stops and stop points.) |
|
PassTransWalkBoard (DSeg) |
Number of passengers boarding at this stop or stop point after walking from another stop or stop point. (This attribute is only available for stops and stop points.) |
Table 235: Indicators of the network performance
Calculation example: Passenger trips per line
- Number of Passenger trips per analysis period
For the bus it applies that 8400 = 200(A->C) + 200(C->A) + 2000(A->X) + 2000(X->A) + 2000(B->X) + 2000(X->B)
For the train it applies that 12000 = 5000(C->X) + 5000(X->C) + 1000(A->X) + 1000(X->A)
- Passenger trips 0 transfers analysis period
For the bus it applies that 6400 = 400(A<->C) + 2000(A<->X direct) + 4000(B<->X)
For the train it applies that 10000 = 5000(C<->X) + 5000(X->C)
- Passenger trips 1 transfer analysis period
For the bus it applies that 2000 = 2000(A<->X with transfer between bus and train)
For the bus it applies that 2000 = 2000(A<->X with transfer between bus and train)
Calculation example: Passenger kilometers per line
- The value Passenger kilometers per analysis period is calculated as follows: PassKm(AP) = Passenger trips • trip distance from Boarding to Alighting stop
For the bus it applies that 2400 • 10 km(A<->C) + 2000 • 27.5 km(A<->X) + 4000 • 7.5 km(B<->X) = 109000
For the train it applies that 12000 • 10 km(C<->X) = 120000
|
Note: Unlike the calculation of transport supply indicators, the projection factor of the demand segment is regarded for the network performance indicators' projection to the analysis horizon (AH) (User Manual: Managing demand segments). |
- The value Passenger kilometers per analysis horizon is calculated as follows: PassKm(AH) = PassKm(AP) • Projection factor of the demand segment summed up over all demand segments.
For the bus it applies that 109000 km • 365 = 39785000 km
For the train it applies that 120000 km • 365 = 43800000 km
- Passenger kilometers per analysis period TI:
For the bus it applies that 9660 km. The calculation can be taken from Image 203:
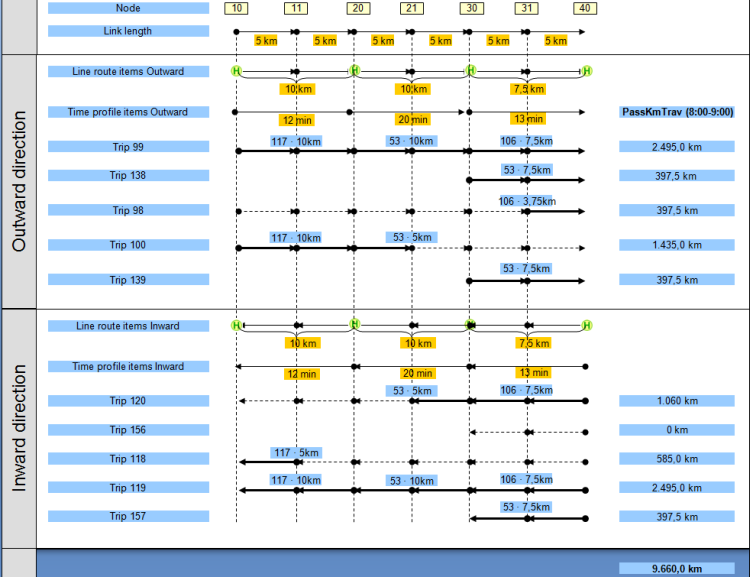
Image 203: Calculation of passenger kilometers between 8:00 a.m. and 9:00 a.m.
For the train it applies that 3 • 10 km • 316 = 9480 km
Calculation example: Passenger hours per transport system
- The value Passenger hours per analysis period is calculated as follows: PassHour(AP) = Passenger trips • Run time from Boarding to Alighting stop.
For the bus it applies that 2400 • 12 min + 2000 • 45 min + 4000 • 13 min = 2846 h 40 min
For the train it applies that 12000h • 16 min = 3200 h
- The value Passenger hours per analysis horizon is calculated as follows: PassHour(AH) = PassHour(AP) • Projection factor of the demand segment summed up over all demand segments.
For the bus it applies that 2846 h 40 min • 365 = 1039033 h 20 min
For the train it applies that 3200 h • 365 = 1168000 h
- The value Passenger hours per analysis period TI is calculated as follows.
For the bus it applies that 255 h 55 min. The calculation can be taken from Image 204.
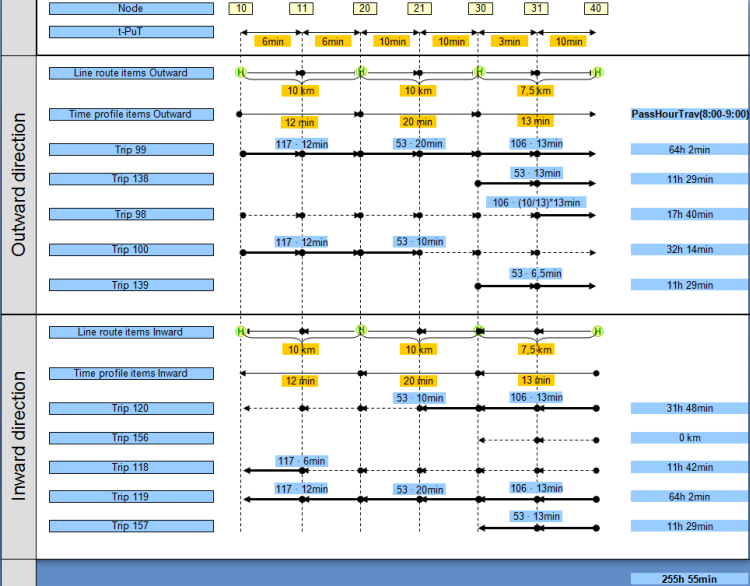
Image 204: Calculation of passenger kilometers between 8 a.m. and 9 a.m.
For the train it applies that 3 • 16 min • 316 = 252 h 48 min
