Using territory-related evaluations, you can calculate indicator data for territories which represent fare zones, urban districts, municipalities or counties for example. The territory polygon is decisive for the calculation; and the indicator's share, which applies to the polygon will be returned (Territories). The example network of Karlsruhe contains six territories (Image 291). In the example, the territories correspond to the PuT fare zones created in the Visum fare model. This means, that the polygons (territory boundaries) were modeled in such a way, that they contain exactly those stops of the respective PuT fare zones. Each PuT fare zone thus corresponds to exactly one territory and the indicators can be calculated by fare zone. Some examples for possible territory-based analyses are introduced below.
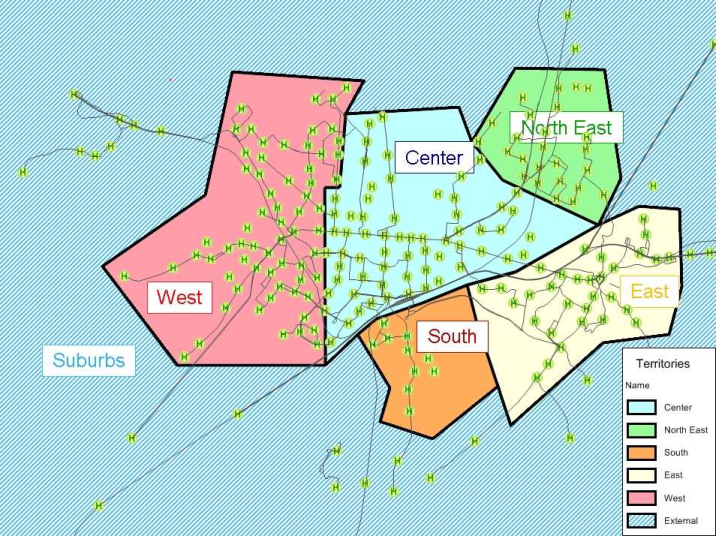
Image 291: Territories in the example
Using the indicators Number of stop points Total, Line network length (directed) and the Number of service trips, information can be obtained on the line routes and the timetable of the model for each territory. Within the territory polygon Center there are 182 stop points. The line network length is calculated per transport system. The directed line length (the total link length of the links traversed via line routes) of the bus network in the city center is 54 km. In the analysis period of one day, 3154 vehicle journeys (number of vehicle journeys with at least one stop within the territory polygon) stop in this territory. Using these indicators as a basis, the first statements regarding the PuT connectivity of the territories can be made.
|
Territory |
Stop points total |
Line network length directed (Bus) [km] |
Number of service trips (AP) |
|
Center |
182 |
54.015 |
3,154 |
|
North East |
53 |
34.993 |
814 |
|
South |
14 |
8.716 |
350 |
|
East |
73 |
90.188 |
1,776 |
|
West |
157 |
66.749 |
1,779 |
|
Suburbs |
96 |
58.474 |
1,888 |
The performance indicators represent the efforts required for the PuT supply provision in length units or in time units. The most used indicator is called service kilometers or service miles, if applicable. These are the main drivers for costs, which arise for the operator of a line The ratio between the service miles and the revenues, which are generated in a territory, can provide information on how efficient the performance is in this territory. In the example, this ratio is stored in the user-defined attribute Revenue_per_ServiceKM. For that purpose, the value of this formula describing the ratio was stored in the user-defined attribute. In this way, also territories can be identified, where it is also very appealing for a PuT operator, to provide transport performance. In the outer regions of the example (suburbs), where fewer passengers have to be transported, however, longer distances have to be covered, less revenues probably accumulate than in the center. Such a view is useful if no costs have been modeled in Visum and simply tendency statements on the cost-effectiveness in a territory are desired.
|
Territory |
ServiceKm(AP) [km] |
Revenue length-proportional (AP) [CU] |
Revenue per ServiceKM [CU/km] |
|
Center |
16,648 |
143,945.75 |
8.65 |
|
North East |
2,918 |
8,674.07 |
2.97 |
|
South |
1,379 |
7,416.01 |
5.38 |
|
East |
6,615 |
24,371.61 |
3.68 |
|
West |
6,328 |
40,159.07 |
6.35 |
|
Suburbs |
11,191 |
4,736.75 |
0.42 |
