If fare points have been defined for links or time profile items of the model, revenue calculation can regard a fixed revenue per traversed fare point (User Manual: Revenue calculation using revenue per fare point).
In the following example, a revenue of 0.20 CU per fare point is specified. The route table (PuT path legs) provides an overview of the calculation.
|
From zone |
To zone |
Line |
From SP |
To SP |
NumFP |
PTrips |
Fixed revenue per FP [CU] |
Revenue share (Weighted with number of path legs) |
|
100 |
200 |
BUS1 |
10 |
20 |
10 |
1501 |
0.20 |
|
|
|
|
Train |
20 |
40 |
20 |
|
0.20 |
|
|
100 |
200 |
BUS1 |
10 |
40 |
29 |
499 |
0.20 |
|
|
100 |
201 |
BUS1 |
10 |
20 |
10 |
200 |
0.20 |
|
|
200 |
100 |
BUS1 |
40 |
10 |
30 |
1000 |
0.20 |
|
|
200 |
100 |
Train |
40 |
20 |
20 |
1000 |
0.20 |
|
|
|
|
BUS1 |
20 |
10 |
10 |
|
0.20 |
|
|
200 |
201 |
Train |
40 |
20 |
20 |
5000 |
0.20 |
|
|
200 |
202 |
BUS1 |
40 |
30 |
10 |
2000 |
0.20 |
|
|
201 |
100 |
BUS1 |
20 |
10 |
10 |
200 |
0.20 |
|
|
201 |
200 |
Train |
20 |
40 |
20 |
5000 |
0.20 |
|
|
202 |
200 |
BUS1 |
30 |
40 |
10 |
2000 |
0.20 |
|


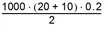


Revenues per line then result from summation of the revenue shares for each PuT path leg.
|
Line |
Revenue per line |
|
Bus1 |
4503 + 2894 + 400 + 6000 + 3000 + 4000 + 400 + 4000 = 25197 |
|
Train |
4503 + 3000 + 20000 + 20000 = 47503 |
Fare points can be defined for links and also for time profile items. In the calculation of the revenue share for each path leg, the sum of fare points at both of those network objects goes in.

