Internally Visum first calculates the revenues for PuT paths. The revenues are then distributed to the PuT path leg and then converted to the network object line hierarchy (lines, line routes, etc.). You can influence the distribution of the revenues by the following parameters.
- With Weight number of path legsyou can achieve an even distribution of the revenue over all path legs. Each path leg receives the same revenue share if the weight is 100 %.
- With Weight number of fare points the distribution will be based on the ratio between the number of fare points on the path leg and the number of fare points on the total path. Thus you can achieve, that longer (in terms of the number of fare points) path legs receive a greater portion of the revenues.
- You can select any weighting between both distribution possibilities, number of path legs and number of fare points.
- When specifying Fixed amount per path leg, each path leg first receives a fixed sum of the total revenue. The remaining revenue is then distributed to the path legs according to the distribution rules mentioned above. If the sum of all of the fixed amounts exceeds the revenue to be distributed, the fixed amounts are correspondingly reduced. If a fare model is used, the supplements are not taken into consideration.
|
Note: Revenue distribution does not regard how the revenue was calculated (fare model, fixed revenue per passenger trip or fixed revenue per fare point). |
For revenue distribution the following formulas are applied
Share of fare points =FarePointsPathLeg/FarePointsTotal
Share path leg =1/NumberPathLegs
Revenue share path leg =(ShareFare • WeightingFarePoints + SharePathLeg • WeightingPathLeg)
Revenue path leg = Fixed revenue + (RevenuePassengerTrips - RevenueFixed • NumberPathLegs) • RevenueSharePathLeg
|
NumberPathLegs |
Number of path legs in a passenger trip |
|
|
FarePointsPathLeg |
Number of fare points in a path leg |
|
|
FarePointsTotal |
Total number of fare points in the passenger trip |
|
|
Revenue share path leg |
Share of the path revenue, which applies to the path leg |
|
|
W-NumFarePt |
Weighting of fare points |
|
|
W-NumPL |
Weighting of path legs |
W-NumFarePt + W-NumPL=1.0 |
|
RevenuePassengerTrips |
Revenue per passenger trip |
|
|
Revenue fixed |
Revenue which is distributed to each path leg as a fixed amount |
|
|
Revenue path leg |
Revenue which is distributed to the path leg |
|
The revenue distribution is also demonstrated with the example Example_LLE.ver. A zone-based fare model was modeled there and the calculation of the input data required for revenue distribution already demonstrated (Revenue calculation using the fare model).
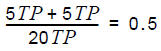
Revenue distribution is only carried out for those paths which comprise more than one path leg. In the example, this is the path from A Village to X City, where 1,000 passengers use the bus and the train, and back. As the number of path leg fare points is 10 for both the bus (A Village – C Village) and the train (C Village – X Town), a distribution factor of 0.5 results in each case.
|
From origin zone |
100 (A-Village) |
|
To destination zone |
200 (X-City) |
|
Links in the course of Path 1 |
1 (Bus) -> 2 (Bus) -> 4 (Train) |
|
Number of fare points on traversed links |
Link 1: 5 (Bus) Link 2: 5 (Bus) Link 4: 10 (Train) |
|
Share fare points(Bus1) |
|
|
Number of path legs of Path 1 |
2 |
|
Share path leg(Bus1) |
|
|
Revenue on Path 1 |
6000 CU |
|
Weighting of fare points |
75 % |
|
Weighting of path legs |
25 % |
|
Revenue path leg(Bus1) |
|

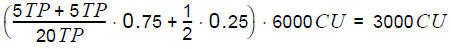
If you want to return the revenues on the line level, the following calculation thus applies.
|
Line |
FromZone |
ToZone |
PTripsUnlinked |
Fare |
Revenue = PTrips • Fare |
|
BUS1 |
A-Village |
X-City |
1000 |
3.00 |
3000.00 |
|
A-Village |
X-City |
1000 |
6.00 |
|
|
|
A-Village |
C-Village |
200 |
1.00 |
200.00 |
|
|
B-Village |
X-City |
2000 |
1.00 |
2000.00 |
|
|
C-Village |
A-Village |
200 |
1.00 |
200.0 |
|
|
X-City |
A-Village |
1000 |
3.00 |
3000.00 |
|
|
X-City |
A-Village |
1000 |
6.00 |
|
|
|
X-City |
B-Village |
2000 |
1.00 |
2000.00 |
|
|
Sum |
=16,400.00 |
||||
|
TRAIN |
X-City |
C-Village |
5000 |
4.00 |
20000.00 |
|
X-City |
A-Village |
1000 |
6.00 |
|
|
|
C-Village |
X-City |
5000 |
4.00 |
2000.00 |
|
|
A-Village |
X-City |
1000 |
6.00 |
|
|
|
Sum |
=46000.00 |
||||


Another calculation example illustrates the calibration options (especially the definition of a fixed amount for each path leg). Let the following network be the example network.
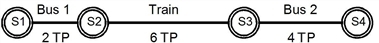
Image 207: Example network for fixed amount per path leg
|
Passenger trips |
3 |
|
Total number of fare points |
12 |
|
Share fare points(Bus1) |
|
|
Share fare points(Train) |
|
|
Share fare points(Bus2) |
|
|
Number of path legs |
3 |
|
Share path leg |
|
|
RevenuePassengerTrips |
3.00 |


|
Path leg |
Share per path leg |
Revenue per path leg |
|
Bus 1 |
1.0 • 0.167 + 0.0 • 0.333 = 0.167 |
0.167 • 3.00 = 0.50 |
|
Train |
1.0 • 0.500 + 0.0 • 0.333 = 0.500 |
0.500 • 3.00 = 1.50 |
|
Bus 2 |
1.0 • 0.333 + 0.0 • 0.333 = 0.333 |
0.333 • 3.00 = 1.00 |
|
Path leg |
Share per path leg |
Revenue per path leg |
|
Bus 1 |
0.5 • 0.167 + 0.5 • 0.333 = 0.250 |
0.250 • 3.00 = 0.75 |
|
Train |
0.5 • 0.500 + 0.5 • 0.333 = 0.417 |
0.417 • 3.00 = 1.25 |
|
Bus 2 |
0.5 • 0.333 + 0.5 • 0.333 = 0.333 |
0.333 • 3.00 = 1.00 |
|
Path leg |
Share per path leg |
Revenue per path leg |
|
Bus 1 |
0.5 • 0.167 + 0.5 • 0.333 = 0.250 |
0.20 + 0.250 • (3.00 - 3 • 0.20) = 0.80 |
|
Train |
0.5 • 0.500 + 0.5 • 0.333 = 0.417 |
0.20 + 0.417 • (3.00 - 3 • 0.20) = 1.20 |
|
Bus 2 |
0.5 • 0.333 + 0.5 • 0.333 = 0.333 |
0.20 + 0.333 • (3.00 - 3 • 0.20) = 1.00 |
When using a fare model (Revenue calculation using the fare model), the distribution of supplements can also be influenced. With the option Distribute supplements to transport systems you have the following possibilities:
- If the option is selected, the supplement charged for the transport system is only distributed to the path legs which are traversed by this transport system. This is how the supplement is only distributed to the path legs, where the long-distance train is used, for example for a connection where a local train without supplement and a long-distance train with supplement are used.
- If the option has not been selected, the supplement is distributed to all path legs according to the distribution key, independent of whether the transport system, for which the supplement was defined, is used for this path leg. This is how a regional train also benefits from the supplement for a long-distance train, for revenue distribution, for example.
An example illustrates the differences between both methods. There is only one fixed supplement in the example. To make it easier, there is no distance-based supplement. The base fare of the connection is 30.00 CU.
|
TSys (#Rank) |
Number of fare points on path leg |
Distribution of the base fare [CU] |
Fixed supplement [CU] |
Transport system-based supplement distribution onto path legs [CU] |
Distribution of the supplement onto all path legs [CU] |
|
EC (#2) |
100.00 |
10.00 |
7.00 |
(**) 3.50 |
2.33 |
|
IC (#2) |
100.00 |
10.00 |
7.00 |
(**) 3.50 |
2.33 |
|
RE (#3) |
100.00 |
10.00 |
0.00 |
0.00 |
2.33 |
|
Sum |
|
30.00 |
(*) 7.00 |
7.00 |
7.00 |
(*) The fixed supplement of the top-ranking TSys (ICE) is only charged once, in this case 7.00 CU.
(**) The supplement of 7.00 CU is only distributed onto both transport systems EC and IC, because they have the same maximum rank. If for example, the IC had a rank 3 and a fixed supplement of 3.00 CU, the EC would obtain the complete supplement of 7.00 CU, when taking the rank into consideration and distributing by transport system.
