The Image 205 gives an overview of the cost and revenue model in Visum and its interrelations with the assignment results. The attribute names are bold in the depiction. Various settings have to be made (User Manual: Parameters for PuT operating indicators calculation).
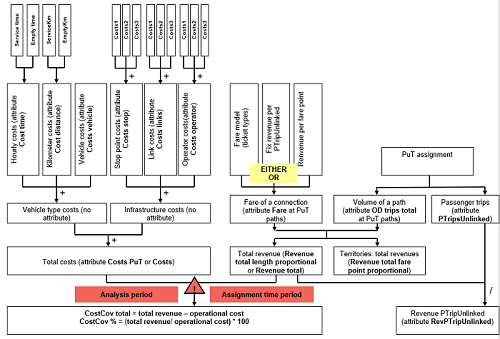
Image 205: Calculation schema for costs and revenues
|
Note: Please note that the reference period for costs and the reference period for revenues have to match, in order to get reasonable cost coverage results. The revenues are calculated for the assignment time period. The attribute OD trips total indicates the number of passenger trips in the assignment time period; it thus varies according to the particular assignment time period. Thus, the revenues also vary according to the temporal position and length of the assignment time period. Cost calculation, however, refers to the analysis period. As the assignment time period often only consists of the peak hour (e.g. evening rush hour from 4-6 p.m.), project the results to the analysis period when you want to calculate cost coverage in your model or combine indicators calculated in the assignment with indicators calculated in the procedure PuT operating indicators (file IndicatorSource.xls in the directory...\Program Files\PTV Vision\PTV Visum 2022\Doc\Eng). To create identical reference periods, at the demand segment, define a projection factor of the assignment time period for the analysis period (User Manual: Creating a cost model). The projection factor 1 is only correct here if you carry out an assignment for the whole day. |
