In order to investigate the behavior of the proposed model and to show the effect of spillback on path choice, we analyze a simple example which presents intuitive solutions. The example is provided with Visum and is located in the Training folder, under DUE, as Braess_without_spillback.ver and Braess_with_spillback.ver.
The following refers to the Braess network depicted in Image 132. Links have the characteristics reported in the corresponding table, and are all modeled with a parabolic-trapezoidal fundamental diagram. All link out-capacities are set equal to the corresponding in-capacities. The turn capacities are QAC = QAE = QED = 2 000 veh/h and QBD = QCF = QDF = 1 000 veh/h.
|
Link |
La[km] |
Qa [veh/h] |
Va [km/h] |
Wa [km/h] |
1 / Ka[m] |
|
A |
0.4 |
2000 |
50 |
15 |
7.0 |
|
B |
0.6 |
2000 |
50 |
15 |
7.0 |
|
C |
0.6 |
2000 |
50 |
15 |
7.0 |
|
D |
0.4 |
2000 |
50 |
15 |
7.0 |
|
E |
0.4 |
2000 |
50 |
15 |
7.0 |
|
F |
0.1 |
4000 |
50 |
15 |
3.5 |
The assignment period is constituted by 100 intervals of 1 minute. For the first 33 minutes of simulation, constant demand flow from node 1 to node 5 is assumed, which equals D15 = 2,300 veh/h.

The results of two assignment runs, one without and the other with spillback congestion, are presented in Image 133. Without spillback, the congestion is evenly located only on turns CF and DF (which can be gathered observing turn travel times), so that on all the paths between node 1 and node 5 the queue is about equal, and path A-E-D-F has fewer users since it is clearly not convenient. With spillback, however, the queue propagates from turn CF to arc C and up to arc A, and from turn DF to arc D and up to arcs B and E. Moreover, the spillback effect is greater on arc B than on arc E because of the different capacities of turn ED and turn BD. Then, after an initial growth, the travel time on arc D remains constant, since congestion is propagated upward, while the travel time on arc B grows faster than the travel time on arc E, so that path A-E-D now becomes competitive, as it implies a longer route but a lower travel time. That is why the flow on arc E increases from around 150 veh/h to 670 veh/h approximately.


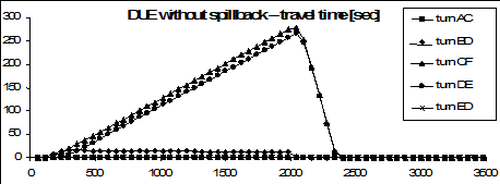
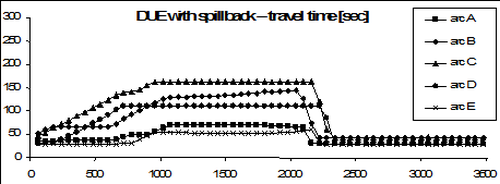
Image 133: Results of dynamic equilibrium assignment with and without spillback
