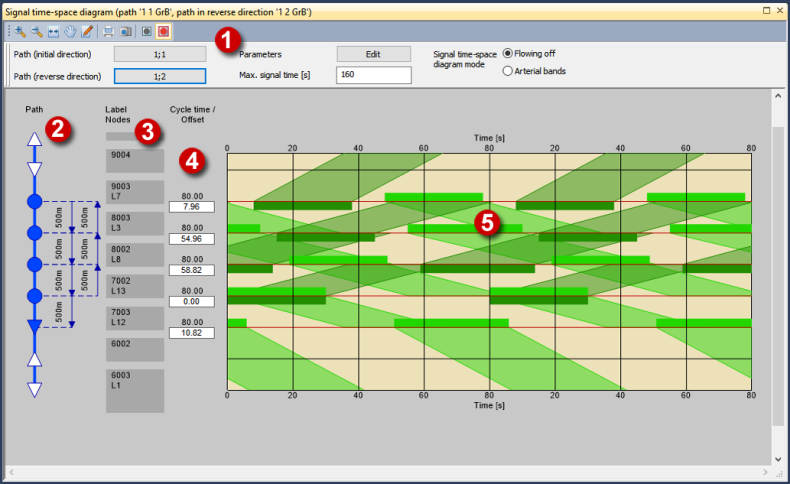
(1) Toolbar
Here you specify settings to change the current display (Adjusting the signal time-space diagram).
(2) Path display
The path is schematically displayed. In the default view the icons have the following meanings:
- Filled circle: Signalized node which is traversed by both paths
- Empty circle: Node without signal control which is traversed by both paths
- Filled triangle: Signalized node which is traversed by just one path (initial or reverse direction)
- Filled triangle: Node without signal control which is traversed by just one path (initial or reverse direction)
You can change the border and fill color of the symbols as well as the display of the links (Setting graphic parameters for the signal time-space diagram).
(3) Node labels
You can specify up to four attribute values for each node (Setting graphic parameters for the signal time-space diagram).
(4) Cycle time and offset
Here the cycle time and offset of the signal controls are displayed. You can change the offset (Changing offsets in the signal time-space diagram).
(5) Diagram
The diagram graphically displays the green bands. The X-axis is the time axis, the Y-axis is the spatial axis. The path's initial direction is top-down, its reverse direction is bottom-up. On the spatial axis you see horizontal red lines at the height of each signalized node. The green horizontal bars represent the green times of the signal controls. The bars of the initial direction are on top of the red line. The bars of the reverse direction are below the red line. You can adjust the display (Setting graphic parameters for the signal time-space diagram).
|
Notes: Links and nodes which are within a main node are not displayed. In the signal time-space diagram you can zoom in or zoom out, you can shift the view or reset it to the initial setting. These functions correspond to those in the Network editor window. You can call them via the View menu, the buttons on the toolbar or the mouse wheel (Network editor window). Additionally, you can stretch or compress the time axis. If you place the mouse cursor on the label of the time axis, it is displayed as horizontal double arrow. Click and move the mouse pointer parallel to the axis to stretch or compress it. |
